

To run a successful agency, you need detailed insight into its finances. You need to know your most profitable projects, your best-paying clients, and a clear picture of your overheads. In this guide, we’ll show you how to understand your agency’s true profit.
Do you know how profitable your last project was - after accounting for all overheads and inside costs?
If you’re like many agencies, you wouldn’t have a ready answer.
Agencies are often guilty of ignoring their financial reporting. It’s easy to see why - you started your agency to do great work, not get bogged down by the nitty-gritty of finance.
But if the quality of your work dictates the kind of clients you get, your financial health decides how long you can serve them. Creativity might be your agency’s heart, but profit is the fuel that drives it.
Getting detailed insight into your finances - across projects, clients, and the entire agency - is crucial for long-term growth.
In this article, I’ll discuss how to understand your agency’s finances and how to use advanced reporting to figure out your true profit.

Get Insight at Agency and Project-Level
Agency financial reporting is often either too sparse, or too detailed. It can be myopic, focusing too much on the status of individual projects. Or it can be too distant and simplistic, offering a basic overview of the agency’s income without any project-level details.
Think of it as the forest and the trees - focus too much on one and you risk missing the other.
For a true picture of your agency’s health, you need both: an agency-wide view of expenses and income, and a detailed view of project and client financial data.
Project-level reports
Every agency has a story about a project that promised to be profitable initially but turned out to be anything but at the end. Hidden expenses, overheads, and inside costs have a way of eating into your profits before you even know it.
Hence, you need project-level financial reports to get a clear insight into the profitability of your projects.
These reports should give you a detailed overview of the financial status of all your projects and clients. You should be able to add up revenues, discount inside costs, and add overheads. You should also be able to access these reports at any time.
The purpose of project-level financial reports is to help you:
- Examine individual projects to understand profit before and after labor costs.
- Compare client vs client profitability so you can allocate more resources toward more profitable clients.
- Compare project vs project profitability so you can pursue similar projects in the future.
- Evaluate your gross margin and help you understand whether you need to revise your pricing.
Agency-level reports
While project-level reports show you a lot, they don’t give you an indication of the agency’s financial health. They don’t factor in expenses incurred when running the agency, including costs not related to the project. Project managers, accountants, and even janitorial services are all essential for the agency’s operations. Yet, you can’t bill clients for them – at least not as a line item.
Hence, you need agency-level profitability reports to help you understand:
- Overhead allocation by client and project.
- Overall agency profitability, as well as profitability by client and project type.
A comprehensive agency financial reporting tool should be able to combine project, client, and agency-level reports in diverse ways to give you a complete understanding of your agency.
For example, the Project Profit and Loss report in Workamajig shows you the profitability of each project after overhead, COGS, and inside costs.
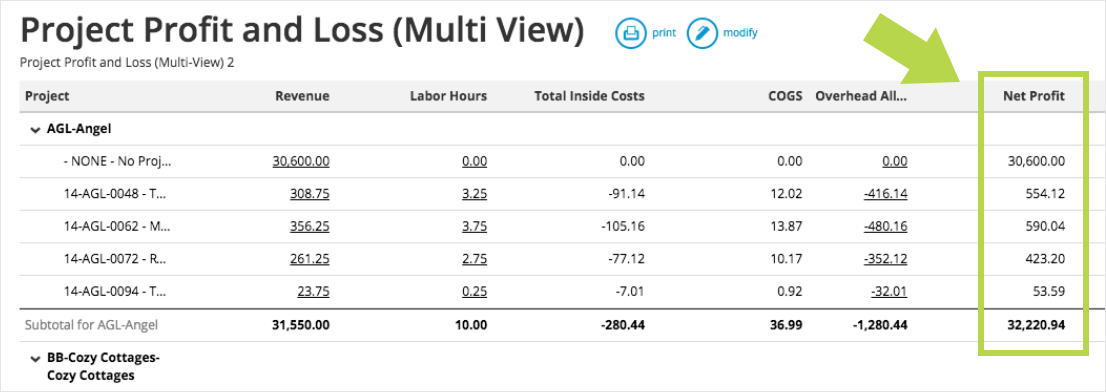
This report is useful for figuring out your most profitable projects and how they relate to the agency’s overall income. Use it monthly, quarterly, and on an annual basis to guide your agency’s direction.
Moreover, this report also lets you filter projects based on their account managers. This can help you figure out which of your account managers’ methods are the most effective at delivering profits. You can standardize these methods to help your agency scale.

Understand Overhead Rates
All of an agency’s expenses can be divided into two buckets:
- Professional Services Cost: The salary cost of the agency’s professional staff used in serving clients.
- Overhead Cost: The total cost of all other expenses, including rent, utilities, software, and non-client-facing staff such as accountants.
Together, these two buckets account for 100% of an agency’s expenses. You can think of the former as the cost of serving clients, and the latter as the cost of serving the agency itself.
A perennial problem for agencies is accounting for overhead costs when billing a client. You can’t bill only for direct-labor costs; you also need to bill clients for the data, tools, rent, and other expenses necessary to keep the agency afloat.
A widespread practice is to use an overhead rate which is nothing but a ratio of the overhead costs to professional services cost.
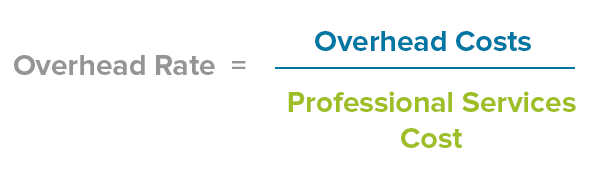
Thus, an overhead rate of 1.00 means that the overhead costs are equal to professional services cost. A ratio of 1.25 means that overhead costs are 25% higher than professional services cost.
The problem is that there is no standardized overhead rate for agencies. As the AAAA says:
“The relationship of an agency’s direct client-labor cost and the agency’s other operating expenses (indirect or overhead costs) are a function of that agency’s business model, infrastructure, staffing philosophy, employee remuneration, benefit plan programs, location and other considerations.”
Overhead rates also tend to vary by industry and agency-type. Media service agencies typically have higher investments in technology, data, and proprietary research than creative agencies. It stands to reason that their overhead rates would be higher as well.
Since there is no standardized rate, and benchmarks are widely divergent, you must figure out what’s the right process for you.
Most agencies use one of three tactics for calculating overhead rates:
By Hours
The total overhead “pool” is distributed across clients based on the number of hours of work done for each client. That is:

Thus, a client that accounts for 10% of the total hours worked will be attributed 10% of the overhead.
By Labor Cost
The overhead pool is distributed across clients based on the cost of labor involved with the project or client. That is:

For example, an agency with 10 employees working for 1,000 hours at a blended rate of $100/hr would have a total cost of $1M. If one client accounted for $100,000 in total cost, you would allocate 10% of overhead to it.
By Total Bill
The overhead pool is distributed across clients based on the dollar amount billed to them. That is:
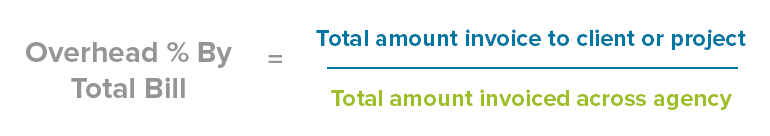
Thus, if you invoiced $100,000 across your agency and $10,000 for a single client, you would allocate 10% of the overhead to it.
It’s a good practice to adopt different overhead rates for different clients based on the project type. A project that demands intense investment in technology and tools should justifiably be charged a higher overhead than a simple logo redesign project.
Look for a financial reporting tool that will let you assign overheads individually for different projects or clients. This will bring clarity to your finances and help you account for the ‘soft costs’ in your budget.
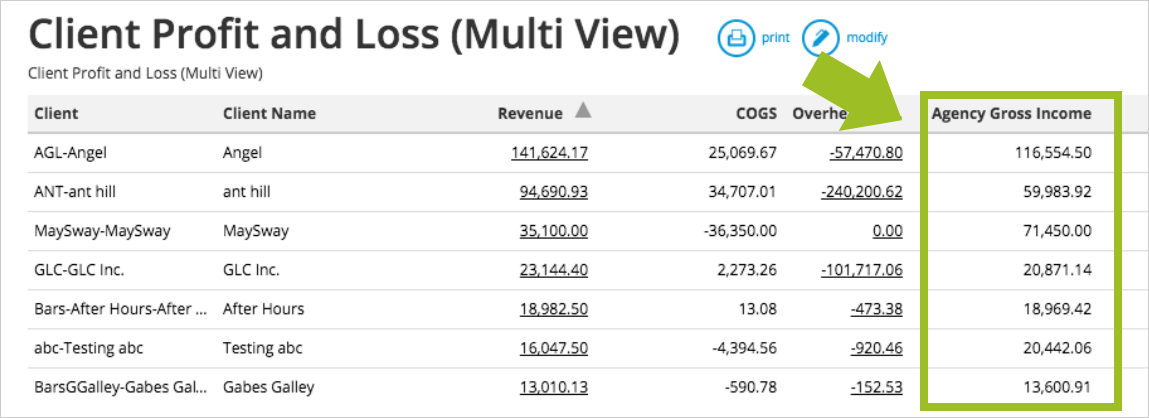
For example, Workamajig Client Profit and Loss report shows you the overhead allocation for each client and project. You can change overhead allocation methods to understand the true profitability of each client.
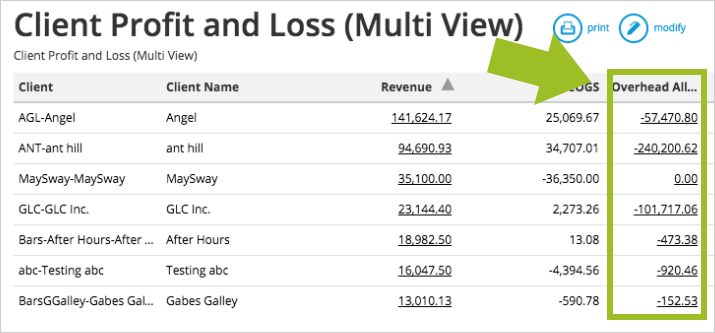
Since this report lines up all the client’s projects and their overheads, it also helps you figure out if you’re over or under servicing a client.

Measure Productivity and Chargeability
There are few businesses that are tied as much to the clock as the agency business. Regardless of what billing model you use, your revenue usually depends on the number of hours you work.
Consequently, two crucial metrics for your agency’s profitability are your realization rate and utilization rate.
Utilization rate is a measure of the total number of hours worked vs total available hours for each employee. It is a “raw” metric in that it doesn’t differentiate between billable and non-billable work. If an employee spends time attending training sessions, updating data, and admin work, it would be classified as ‘work’.

Thus, an employee who works 1,600 hours and spends 200 hours in training out of an available 2,080 hours has a utilization rate of 86.5%.
Realization rate is a measure of your recorded vs billed time. It’s a more specific metric in that it doesn’t include time taken off for training, internal projects, etc.

Thus, if you assume that an employee must take 480 hours off each year for vacations, internal projects, and training, you would have 1,600 actual billable hours left. If the employee works for 1,200 of these hours, your realization rate would be 75%.
A higher realization rate effectively bumps up your actual billing rate. If you bill clients at $100/hour, but have a realization rate of 50%, you’re effectively making $50/hour in an 8-hour workday.
This is called the realized rate for the employee. That is:

Together, utilization and realization rates give you a picture of your agency’s productivity and chargeability.
It’s important to track these rates for each employee for both chargeable and non-chargeable tasks. If you plan 1,000 chargeable hours for an employee but can bill for only 500 of them, it shows that you’re not fully utilizing the employee.
Similarly, if you plan for 200 non-chargeable hours and utilize only 25% (i.e. 50 hours), it shows a lapse in planning.
On the other hand, over-utilizing your non-chargeable hours means that your people are spending too much time on non-essential tasks.
For example, Workamajg has a built-in chargeability report for each employee, organized by department. This shows you the percentage of planned vs actual utilization for both chargeable and non-chargeable hours.
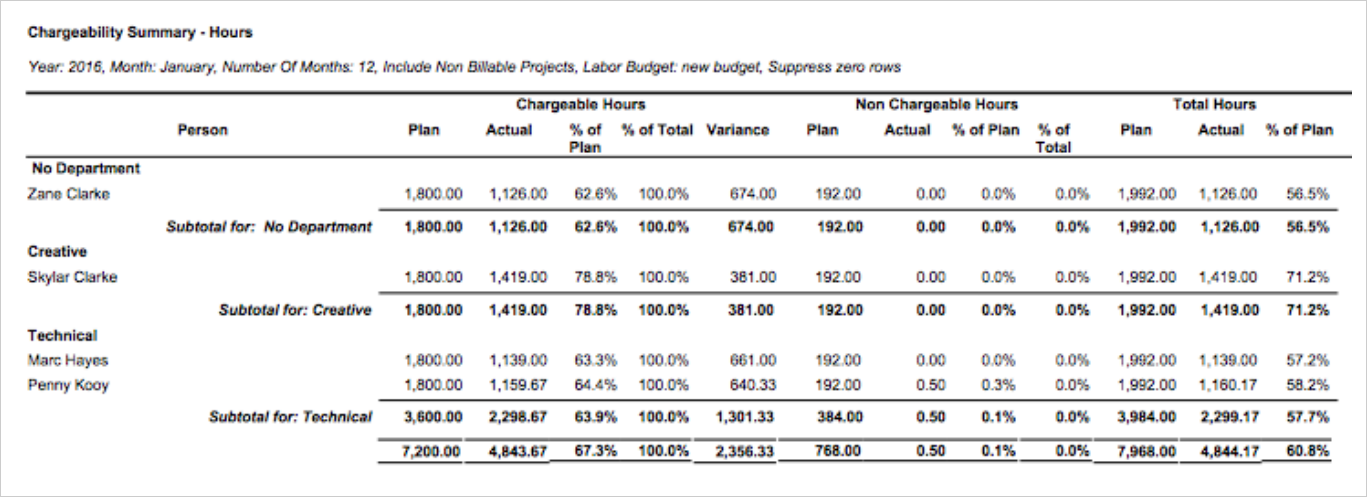
This shows you whether you’ve over-planned or under-utilized any resources, and whether you’re meeting your targets.
Another great report is the Project Hourly Realization Rate. This shows you billable vs non-billable time for each client, project, or task.

This can tell you which projects eat up your resources’ time, and which ones deliver the highest profits for the hours worked. You want to focus on projects that your resources waste the least time on.
Similarly, the Time Productivity Analysis helps you understand the actual hourly rate for each resource. You can tie it to a dollar figure to get a measure of your profitability for every employee. Use it to find your most profitable employees and guide your future hiring.
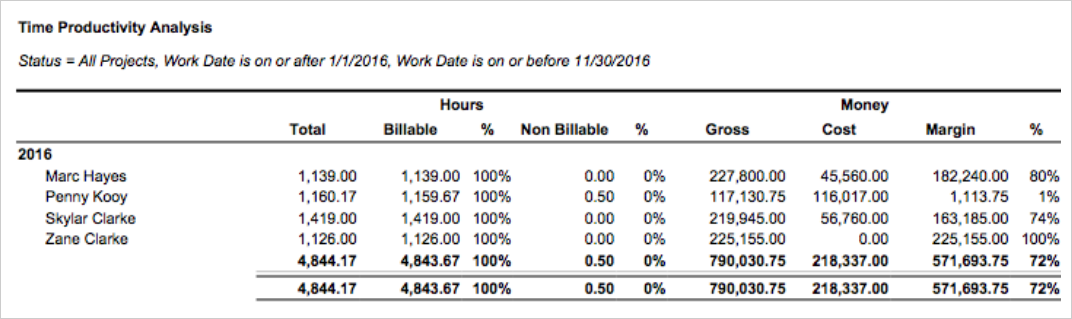
For example, you might have billed a client at $100/hour for a project. But if you finish the work in 100 hours instead of 200 hours, your realized rate would effectively be $200/hour.
Focusing on these reports is crucial for getting a clearer picture of your agency’s profitability.

Focus on Agency Gross Income (AGI)
If you’re like most agencies, you likely depend on gross billings to track your agency’s financial health.
But as Drew McLellan, founder of Agency Marketing Institute, says, “Gross billings are irrelevant.”
Gross billings is a measure of the total money coming into the agency’s bank account. It doesn’t tell you anything about your profits or even your actual revenue. The agency might use the bulk of this amount for media placements. Or it might keep it as revenue, depending on the agency type.
Instead of this misleading metric, focus on tracking your agency's gross income (AGI) instead (sometimes also called ‘adjusted gross income’).
AGI is a measure of your gross billings minus your client-related expenses (COGS).

Your AGI is the amount of money you get to keep after serving the client. All your agency expenses – salaries, rent, utilities, etc. – will be drawn from this pool.
As such, tracking the AGI gives you a much better understanding of your agency’s financial health. Drew McLellan advises agencies to follow the “55-25-20” ratio where:
- 55-60% of AGI is spent on payroll
- 20-25% of AGI is overhead
- 20% of AGI is your EBITDA
Tracking the AGI tells you whether you’re overstaffed (i.e. payroll is > 65% of AGI), if you’re paying too much rent (i.e. overhead > 25% of AGI), or if your profit margins are too low (i.e. your EBITDA is under 15%). Sticking to the above figures is an indication that it’s going to be a good year.
AGI is a key metric in Workamajig’s client and project-focused reports. You can see the AGI for each client, project, and the entire agency. This gives you a clear idea of the actual money you make from each project.
Tracking AGI also makes it possible to track another key agency metric: the AGI:FTE (Full-Time Equivalent) ratio.
Use AGI:FTE Ratio
The AGI:FTE ratio tells you how much money you’re making for each full-time employee. Calculating this ratio is easy – simply divide your AGI by the total number of full-time employees.
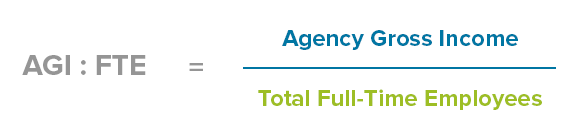
The higher this ratio, the more money you’re bringing in for each employee.
Ideally, this ratio should be at least $150,000. Revise this figure higher if you work with expensive technical talent or operate in an expensive area.
Another AGI-related metric you should track is “client concentration”, i.e. the percentage of AGI made up by your largest client.

A high client concentration (>25%) means that your income depends too much on a single client. Anything above 35% should be a cause for alarm. Anything between 10-25% is a good range to aim for.
Tracking AGI opens-up the possibility of understanding your agency’s finances much better. Instead of gross billings, make this your “one metric to rule them all”.

Keep Track of Budgets
Cost-overruns are shockingly common, especially in technologically or creatively complex projects. On average, both software and non-software projects have an average cost overrun of 45%, according to McKinsey.

While the reasons for cost overruns can be many, two of the biggest causes are:
- Inadequate budgeting
- Inadequate budget tracking
The first cause is typically tied to the way you incorporate hard and soft costs in the project budget. Hard costs – expenses billed to the client – are easy enough to estimate. However, errors in estimating soft costs (indirect expenses that can’t be billed) often lead to poor budgeting.
Soft costs include everything from project management time to non-billable staff time and supplies. You need to understand what percentage of this staff time/supplies will be used up for each project and factor it into your budget accordingly as soft costs.
For example, a project requires 10 hours/week of your project manager’s time, i.e. 25% of available time. If you pay your project manager a salary of $100,000/year, you need to factor $25,000 into the project budget to pay the PM.
One way to better account for soft costs is to use integrated project management software. This software can bring all your resources on the same platform, making it easier to track how they’re used for each project. This, in turn, can ensure that you don’t skip any soft costs in your project budgeting.
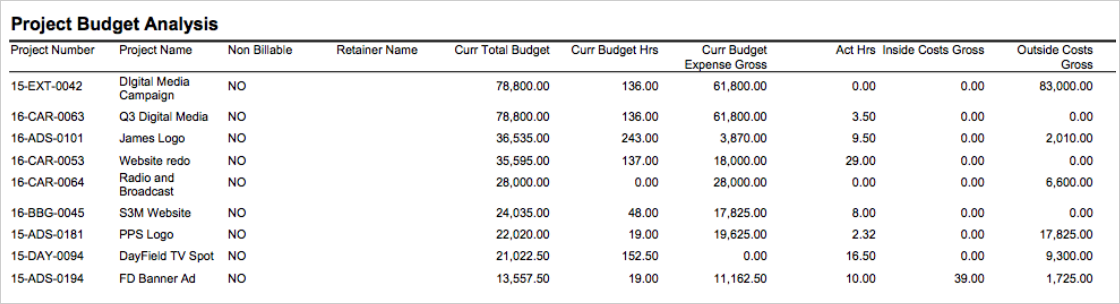
While accounting for soft costs is important, you also need a way to keep track of project budgets in real time. You need to know how much of the budget you’ve used up and how much is remaining, aka your burn rate. This way, you can take measures to avoid going over-budget.
Workamajig’s Project Budget Analysis reports help you do exactly that. You can compare budget vs actual spending and see a breakdown between inside and outside costs on a rolling basis. This will give you clear visibility into the project’s progress and help you avoid cost overruns.
Over to You
Running a successful agency means understanding its finances. It’s not enough to track billings and expenses; you also have to factor in inside costs and overheads. Further, you need all this financial data readily available to figure out your best clients and most profitable projects.
The five tips I shared above will help you get better insight into your business. Use them to zero in on your agency’s true profits.