

What is Marketing Agency Reporting?
Marketing agencies do all sorts of things, from creating ads to branding campaigns to running a company’s social media. At the end of the day, though, their clients only really want to know one thing…
What were the results? Did the ad increase customer purchases? How many clicks did the email get? How much engagement did the Instagram post generate?
Marketing agency client reporting is a major part of agency reporting, as without the stats, your clients won’t know what your efforts have achieved and will have little reason to come back to you a second time.
The second aspect of agency marketing reporting is for the agency’s own sake. As a marketing agency, you want to know how YOU are doing as a business and need a way to track that.
In this blog, we’ll explore the various types of reports that you can run and what each is useful for, as well as discuss best practices for getting the most out of your reports.
Image by Vectorpouch on Magnific
Key Takeaways From This Blog:
- Reporting serves two audiences: your clients and your own agency.
- There are six core report types: social media, SEO, web analytics, PPC, email, and time reports.
- The biggest reporting challenge is pulling data from disconnected tools and not knowing what to measure.
- A good reporting system automates data collection, consolidates channels, and updates in real time.
- Tailor KPIs to each client, lead with the most important results, and always reference historical data for context.
- Reports are a powerful tool for client retention and upselling, not just a contractual obligation.
- Platforms like Workamajig unify project management, time tracking, and financials, automating reporting rather than making it a manual task.
Why is Marketing Agency Reporting so Important?
Simply speaking, the best way for your agency to show off its marketing prowess is by showing current and prospective clients how much money you are helping them make.
The way you do that is through marketing performance reports that show performance metrics like KPIs, click rates, and conversions.
Not only do reports show clients a breakdown of what you are doing for them, but they also prove why it’s worth their while to pay the amount that you are charging for your services. If you can show them the details and extent of the work behind the results you are producing for them, they will consider your fee an investment.
Moving on to the marketing agency itself, reports are what keep your agency healthy. Without running reports at least once a month, an agency soon descends into a chaos of confusion, where no one can accurately determine whether the agency is progressing, regressing, or staying stagnant in its growth. Reports are vitally necessary for making informed marketing strategy decisions.
But here’s something most reporting guides won’t tell you: the biggest challenge isn’t knowing what to report, but rather the operational chaos behind getting that data together. Most agencies are pulling marketing data from a dozen disconnected data sources: project management software, time tracking apps, ad platforms, CRM systems, and accounting tools, and at the end of all that, they often end up copying figures into spreadsheets just to make sense of it all. In digital marketing, where speed of insight is everything, this fragmented approach means reports take hours to compile, data often conflicts between sources, and by the time you’ve reconciled everything, the information is already outdated. We’ll address this throughout the guide, including how the right reporting infrastructure can make that friction history.
What Are the Six Core Types of Marketing Reporting?
1. Social media report
Nowadays, social media is heavily utilized as a business tool, whether for advertising, campaigns, or just general posting to increase brand awareness.
The more on top of social media metrics an agency is, the better placed they are to make strategic decisions, such as which platform to use the most and what type of posts to focus on.
Metrics you can use to track your social media success include:
• Reach
• Interactions
• Impressions
• New followers
2. SEO performance report
When it comes to content marketing and websites, SEO performance is a crucial way to track success. You can have a super informative blog or a beautiful website, but if the SEO is poor, they won’t help anyone much, as your search engine rankings will suffer, and very few people will see them. Also, organic traffic numbers are only meaningful in context; you must always compare to the previous period and highlight which specific pages of keywords are driving growth. To track SEO performance, track metrics such as:
• Conversions
• Bounce rate
• Organic traffic
• Paid traffic
• Amount of time users stay on the page
3. Web analytics report
Web analytics reports are similar to SEO reports but focus more directly on how users interact with the website. Tools like Google Analytics are commonly used to generate this data, giving you a granular view of user behavior across your site. Device data is particularly actionable: if, for example, 70% of traffic is mobile, but the conversion rate on mobile is half that on desktop, you’ve identified a clear optimization opportunity for your client.
Ways to track web metrics may overlap with SEO metrics and include:
• A device used to access the website
• Amount of time users stay on the page
• Conversion rate
• Bounce rate
• Number of pages explored, as well as the most popular pages
• Website Traffic
• Demographics of people visiting the website
4. PPC campaign report
A pay-per-click campaign runs online ads, for which you pay a certain amount every time someone clicks on your ad. Where possible, connect as spend directly to ROI. Even an estimated cost-per-acquisition is more meaningful to a business owner than a click-through rate alone.
The success of a PPC campaign can be measured using:
• Number of clicks
• ROI
• Cost per click
• Click-through rate
5. Email reports
Email reports provide valuable insights into the success of your emails, indicating areas where you can improve your results. Information such as which subject lines worked best, what timing yields the highest open rate, and which demographic is most interested in your emails can help you streamline your email marketing. Surface patterns proactively rather than waiting for clients to ask. For example, if there are consistently high open rates but low click-through rates, that tells a specific story: the subject line is working, but the body or CTA is not.
Track your email success using the following metrics:
• Open rate
• Click rate
• Click-through rate
• Unsubscribes
• Bounces
• Replies
6. Time reports
Time reports are the way you measure how cost-effectively time is being used in your agency. Time reports give you a monthly breakdown of how marketing teams and employees spend their working hours, giving you a clear view of how you are spending your resources.
Useful metrics to track include:
• Time spent on tasks
• Total hours worked
What Should I Look For in a Marketing Reporting System?
Before jumping into best practices, it’s worth stepping back to ask: what does a genuinely good reporting system look like? Not just individual reports, but the underlying infrastructure that makes the entire reporting process accurate and scalable?
These are the most important features to look for when investing in a reporting tool:
• Automatic data collection and data integration: The system should capture project data, like deliverables, hours worked, and costs incurred, at the source, without requiring manual entry. If you’re still copying numbers from one tool into another, you’re building on a weak foundation.
• Cross-channel consolidation: Paid ads, organic social, email, and web analytics data from tools like HubSpot and Google Analytics should feed into unified client dashboards across all marketing channels instead of sitting in separate silos.
• Real-time automated reporting: Reports that require manual refreshes are always out of date. Automated reporting means data updates as work happens, so you’re never presenting yesterday’s numbers.
• Scalability with white-labeling: Adding a new client shouldn’t multiply your workload. Report templates, white-labeling options, and workflow automation allow you to serve 50 stakeholders with the same effort as 10.
• Connection to marketing strategy and business outcomes: Ultimately, clients want to see return on investment, not just impressions and clicks. Your reporting system should enable you to connect marketing activity to leads and actual revenue.
The functionality you’re looking for goes beyond dashboards. The best analytics tools make it easy to drill into key metrics, build custom reports by client or campaign, and track campaign performance across every channel in one place. The fundamental limitation of many standalone marketing reporting tools is that they sit downstream from your operations data. They can visualize beautifully, but they don’t solve the root problem: your project hours, costs, and deliverables live in separate systems that require manual aggregation before you can report on them. Platforms like Workamajig take a different approach by unifying project management, time tracking, and financial data in one place, making reporting automatic rather than a separate manual task.
What are Some Best Practices for Client Reporting?
1. Provide only relevant information: When providing clients with reports, you want to include only the key metrics that are relevant and interesting to the client. Your clients are busy, and the service you are providing them with is only a small part of their focus. They don’t want to be swamped with uninteresting data.
2. Templatize your reports: As an agency, presenting clients with reports is standard practice, and anything that is standard practice does well to be templatized. Using report templates means that instead of creating a customized document every time you send a report, you have that basic template and just fill it with the relevant information.
3. Make them visually appealing: There’s a world of difference between a black-and-white report with numbers and words squashed closely together and a sleek, colorful, and clear report. Good data visualization — charts, graphs, and color-coded dashboards — makes reports far easier to digest and far more likely to be read. You want your clients to be motivated to actually engage with your reports and see how much your services are helping them.
4. Dumb it down: Although stats like ‘high click-through rate’ might be ABCs to you, your client may not fully understand what that means and why it’s a positive thing for their business. Always err on the side of caution and ensure that you explain what the data in reports actually means.
5. Reference past data: Imagine you’re working with an agency that previously had very little website traffic, and you helped make a tremendous increase in that traffic. Showing them a report showing current traffic is a good start, but you’d do much better to compare it to past data, highlighting the difference you have made. If you’ve made a positive change for a client, always compare current data to historical data in reports.
6. Put the most important information first: Your client may only have a limited amount of time or patience to read the reports you send them. It’s therefore imperative that you place the data that you want them to see first. Let’s say your agency wrote a post that received a tremendous amount of engagement, as well as some other posts that were not as successful — put the most successful results first! Also, ensure that the data most important to your client is placed near the top.
7. Include future plans: Make your clients feel secure in your agency’s capabilities by referencing future plans. This is also important if the data in your reports is not so positive. Rather than trying to cover up unfavorable reports, which can easily lead to a lack of trust, be transparent and tell your client how you hope to do better in the future.
8. Automate your report sending: This is an easy step to take that can save you hours of work. Automated reporting means your system sends out the most up-to-date report to clients on a weekly or monthly schedule, without anyone having to remember to do it manually. If your marketing reporting tools don’t support this, it’s worth switching to ones that do.
9. Tailor KPIs by client type: Not all clients should receive the same report. E-commerce clients care about revenue attribution and ROAS, whereas B2B clients want to see pipeline and qualified leads. Brand awareness marketing campaigns live or die on reach and engagement. Tailoring the metrics you highlight to each client’s business model makes your reports feel genuinely useful rather than generic.
10. Standardize how you define KPIs across your agency: If different account managers calculate ‘engagement rate’ differently, you can’t benchmark performance meaningfully. Agree on definitions internally, document them, and explain them.
11. Use reporting as a retention and upsell tool: Instead of just viewing reports as a contractual obligation, see them as an opportunity for client retention and attracting new clients. A well-structured report that clearly demonstrates ROI makes renewals easier and naturally opens conversations about what else you could be doing for the client. On the flip side, poor reporting, late, inaccurate, or vanity metrics are one of the most commonly cited reasons clients leave agencies.
12. Match report frequency to the decision-making cycle: Fast-moving paid marketing campaigns benefit from weekly reporting that enables quick optimization. Long-term SEO and content marketing strategies are better reviewed monthly or quarterly. One reporting cadence doesn’t fit all clients or all channels.
How can Workamajig Help you With Your Marketing Agency Reporting?
For some agencies, reporting is a pleasant and easy walk in the park. For others, it’s a monthly headache, zapping hours of precious time and creating a lot of boring tasks for a lot of employees.
So what’s the secret to happy, snappy reporting?
Simple: Marketing agency reporting tools.
With the best marketing agency reporting tools, you get to provide your clients as well as your own agency with effortless, beautiful reports. Without them, you get to spend many tedious hours pulling data from here, there, and everywhere, putting shoddy-looking reports together on your own.
Piece of advice: don’t do it!
If you are a creative agency, the best software you can invest in is Workamajig — the only platform built specifically for creative agencies.
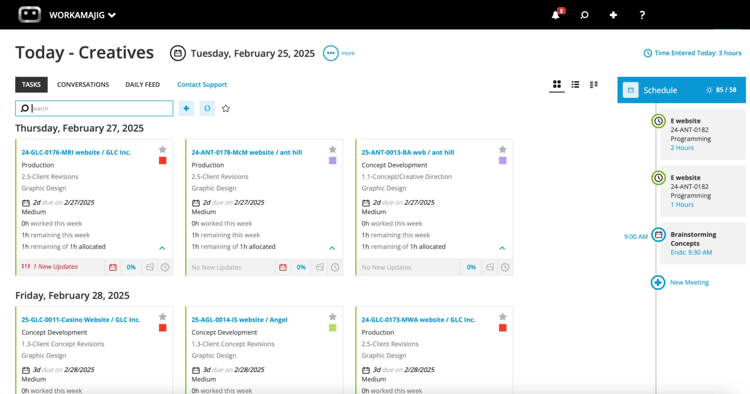
What makes Workamajig different from standalone reporting tools is where it sits in your workflow. Most reporting platforms are purely visualization tools; they take data you’ve already collected and make it look good. Workamajig is an all-in-one platform where the work actually happens: project planning, task execution, time tracking, client communication, and financial management all live in one system. That means your reporting data is complete and real-time without any manual aggregation, and even better, you can build custom reports that connect your marketing efforts directly to return on investment.
White-labeling options mean every client-facing report looks polished and on-brand, while built-in data integration pulls from all your marketing channels without the need for third-party connectors.
Specifically for agency reporting, Workamajig offers:
• Native time tracking integrated directly into project workflows, so labor hours and costs are captured automatically at the task level, which means no separate timesheet tool or gaps in your cost data
• Real-time project dashboards with color-coded health indicators, so account managers can spot issues before clients ask questions
• Client portals that give customers 24/7 access to project status, deliverables, and budget usage. This reduces status-update emails and positions you as transparent and organized
• Agency Insights dashboard that consolidates marketing data across all clients and projects, helping leadership understand resource utilization and profitability by client or service type
• Automated invoicing that pulls directly from projects and timesheets
• Integration with media buying platforms (Strata, Mediaocean) to pull ad spend into project budgets automatically, giving you easy-to-read campaign performance visibility
Run your agency on hard data, not best guesses
Swap gut feelings for accurate data and dramatically improve your agency’s profitability. Workamajig provides agency leaders with the visibility they need to identify their top clients and highest-margin projects.
• Do more of what works. Identify & focus on the clients, projects & services that drive true profitability
• See how your key financial metrics trend over time with our easy-to-use Metrics Monitor
• Grow with confidence. Improve cash flow, make smart hiring decisions & build an agency that lasts
Integration gives you insight
Why use separate tools for time tracking, project management, resourcing, finance, and reporting?
Get everyone on board & gain visibility across the board.
• Don’t wait hours for reports — get the data you need, when you need it, in real-time
• No need to gather & merge data from other tools — just start analyzing
• Reliable forecasts let you proactively manage agency growth & resources
• Create reports for anyone, with the exact data they need
• Make smart, data-backed decisions — explore Workamajig here
Make smart, data-backed decisions - explore Workamajig here
FAQs
What is a marketing agency reporting example?
Some examples of marketing agency reports include:
- Social media reports that show how a client’s Instagram and LinkedIn accounts are doing by breaking down monthly reach, engagement, and growth.
- PPC campaign reports that break down ad-spend, click- through rates, cost per click, and estimated ROI for Google Ad campaigns.
- Email marketing reports detailing open rates, click rates, and the number of new subscribers as well as unsubscribes.
Reports like these can be client-facing or internal, showing the health of your own agency.
What are the biggest challenges agencies face with reporting?
The main challenges agencies face with reporting are difficulties in efficiently gathering useful data. When an agency uses a plethora of tools, like CRMs, PM software, and accounting systems, they struggle to build a true picture of what is going on.
Another difficulty is manually plugging data into spreadsheets, which zaps the agency of time that could have been spent on billable work and is also error-prone.
Importantly, when an agency is confused by all the different tools and data on a project, by the time they finish pulling everything together, it’s already outdated, and it becomes difficult to remember which data matters to each client.
How often should I send reports to clients?
Different types of reports and different types of clients benefit from different reporting cadences. Reports like media campaign reports need weekly reporting as optimizations need to be timely, whereas SEO and content marketing reports don’t need to be reported on more than monthly as results don’t develop so fast.
To make things easier for yourself, you can automate report sending so that you don’t forget to send reports and save yourself time. And remember, the most important thing is to communicate with clients so that you know what reports THEY want and at what frequency.