

The best marketing teams can generate out-of-the-box ideas through robust systems that promote efficiency and collaboration. Task visibility and resource management are key to achieving these.
A Gantt chart is a powerful tool to increase task visibility. Teams across all industries use it to create schedules with more precision.
At a glance, a Gantt chart displays tasks the team needs to do and how each task relates to the other. These capabilities allow project managers to plot the most efficient approach.
What is a Gantt Chart?
Gantt charts are horizontal bar graphs that represent the tasks needed to complete a project, along with the schedule of when they’re expected to start and end. They also illustrate dependencies, hierarchies, and relevant milestones.
It was popularized by the American engineer Henry Gantt. They were initially drawn by hand and were tedious to maintain. But with the rise of computers in the 1980s, Gantt charts became easier to manage and rose further in popularity.
Click here for our free Gantt Chart template.
Types of Gantt Charts
Their scope and level of detail distinguish the two types of Gantt charts.
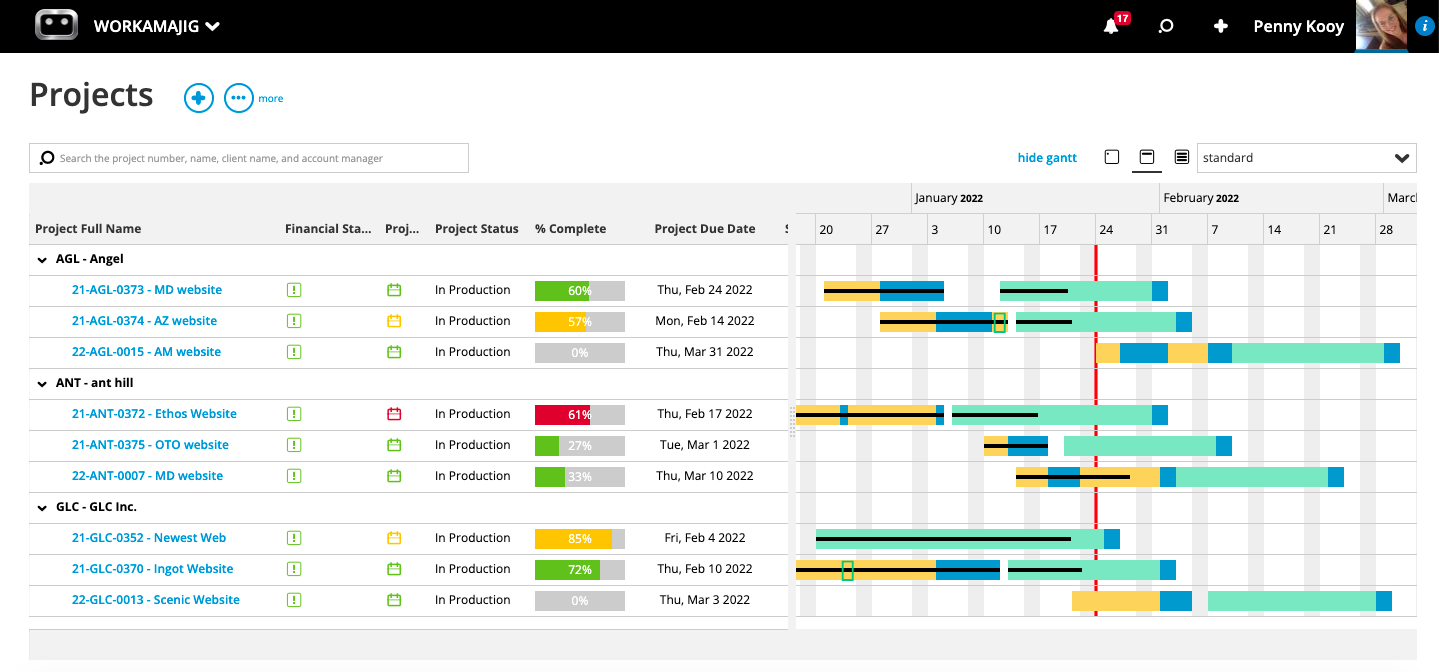
1. High-Level Gantt Charts
High-level Gantt charts help monitor major company initiatives. The time intervals here are usually in months or quarters because each line item represents efforts that involve hundreds of tasks and a handful of teams.
A Gantt chart that tracks your marketing communication campaigns across the year is an example of a high-level Gantt chart.
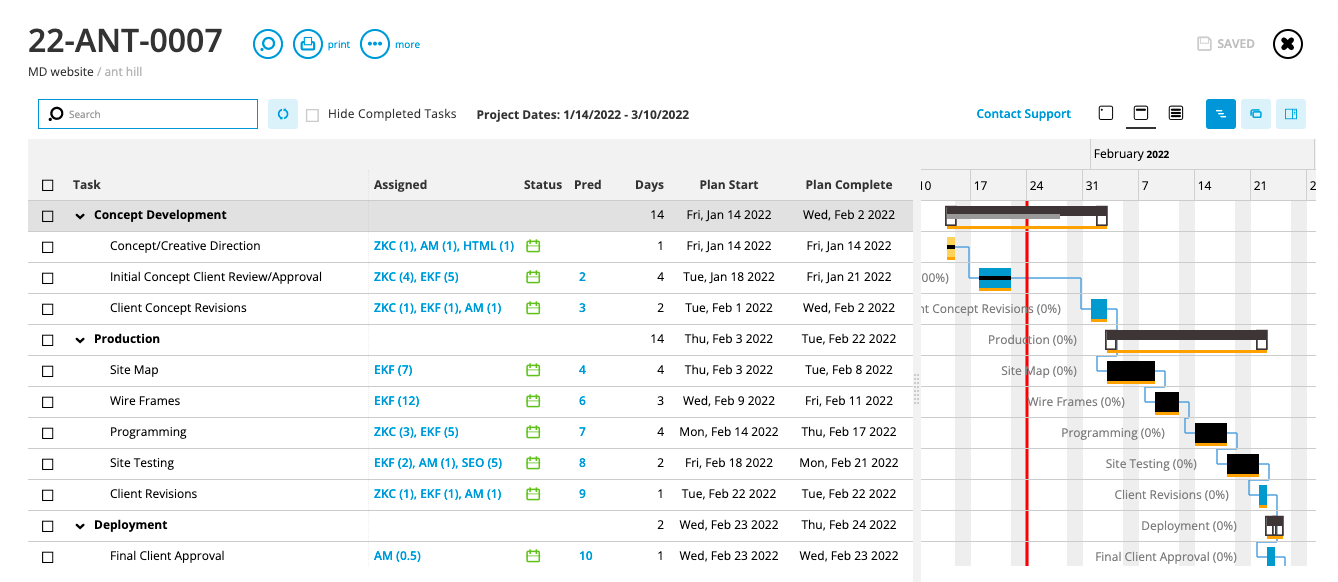
2. Project-Level Gantt Charts
Project-specific Gantt charts monitor smaller projects usually connected to a major initiative. The tasks here can be nitty-gritty, so time intervals are typically days or weeks. On some occasions, it can even be hours.
Following our marketing communication campaign example above, a project-specific Gantt chart tied to it can be one for tracking articles to be published in your blog.
Using both types of Gantt charts in this scenario can help you produce content at scale while ensuring that they all align with your campaign’s key messages.
How to Read a Gantt Chart
To read a Gantt chart, you’ll need to understand what each part represents.
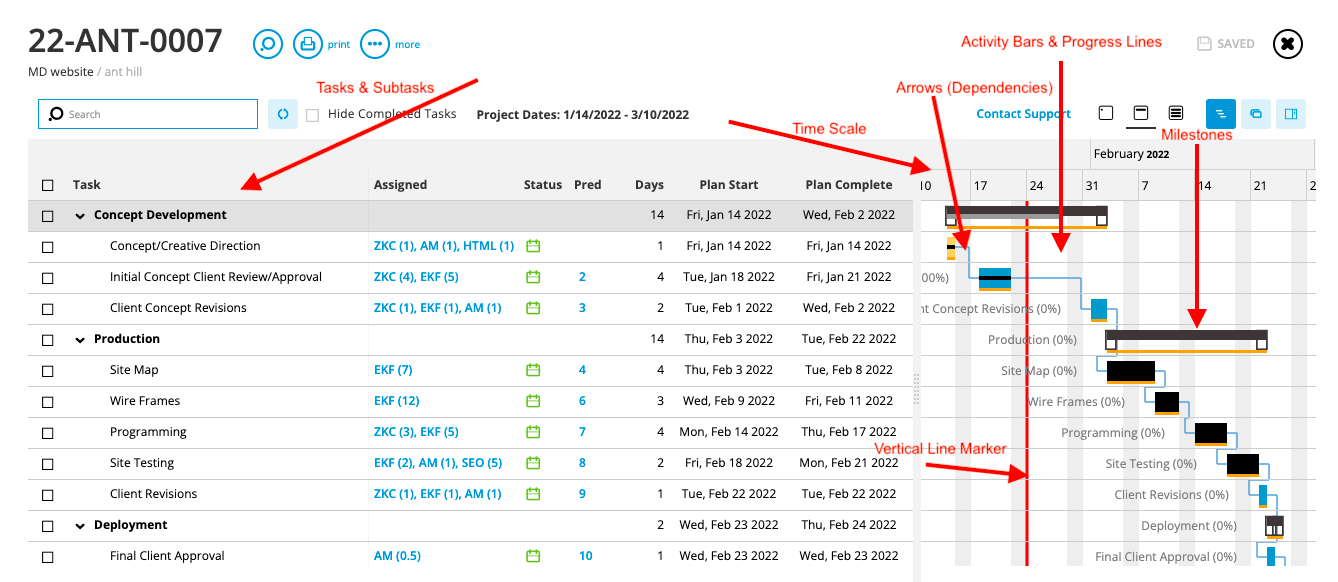
Time Scale
The top of the Gantt chart’s x-axis illustrates the time interval you want to use to track your tasks. These can be in days, weeks, months, or quarters. Sometimes, even hours.
Tasks & Subtasks
The leftmost side of the Gantt chart lists the tasks you need to accomplish to move the project forward.
Activity Bars and Progress Lines
The bars on the Gantt chart reflect the estimated duration for tasks to finish. Inside the bars are lines that show the team’s progress.
When lines are inside the bar graph, it means that work is on track. Lines that go beyond it indicate tasks going over their intended schedules. These can signal delays for dependencies or the need for additional follow-up, budget, or resources.
Milestones
Milestones serve as checkpoints toward the completion of a project. Diamonds represent them because they typically don’t have durations the way regular tasks do.
Arrows
The arrows that connect activity bars from each other signify tasks that have dependencies on each other. We’ll talk more about dependencies in a later section, but they’re essential considerations when scheduling.
Vertical Line Marker
The vertical line marker helps you identify the activities being done at a certain point in time. As a project manager, this can help you see who to check in with to ensure they receive the support they need.
Advantages & Limitations of Gantt Charts
Gantt charts are incredible tools. But they also have strengths and weaknesses.
Why Use a Gantt Chart?
Visualize Project Activities
Gantt charts can display massive amounts of information at a glance: your critical path, progress, and milestone deadlines, to name a few. This birds-eye view of your project’s activities can help you make better calls and improve your communication with your stakeholders.
Structure Your Activities
The need to break milestones and deliverables down to actionable tasks pushes you and your team to inspect, evaluate, and organize your plans. This supports alignment and helps ensure clarity.
Make Accurate Schedules
Contrary to an outsider’s perspective, schedules can’t be deduced by simply adding all your estimates and dividing them according to the number of people you have in your team.
You need to consider dependencies, and Gantt charts can help you keep them in view. Having this information on hand as you commit deliverables with your stakeholders will help you plot realistic schedules and deadlines.
Engage Teams and Stakeholders
Seeing tasks structured on a Gantt chart is an excellent way to help your team see how their day-to-day activities contribute to the bigger picture. Its digestible format makes it easy to align with stakeholders as well.
Manage Changes and Scope Creep
Scope creep and overservicing your clients are massive contributors to project failure. When stakeholders inquire about new requests, your Gantt chart can help you communicate how it’ll affect your production schedule. Handing over this piece of information will enable them to evaluate if it’s still worth adding and agree on a reasonable compromise.
What are the Disadvantages of a Gantt Chart?
Can Grow Complex
Gantt charts are handy because they remain tidy and organized. Without proper filtering, they can grow cluttered, distracting, and eventually, incomprehensible.
To manage this, pick software that allows you to group, filter, search, and organize tasks with ease. These features can help you ensure that your Gantt chart is helping your team stay focused on the proper milestones and priorities.
Limited Information
Your Gantt chart can show a large amount of information. But it can’t show you all of them. While it can effectively display your schedule, manpower assignments, and task durations, it can’t show the tasks’ level of difficulty, and the resources you’ll need to accomplish them.
Avoid making major decisions solely on what you see on your Gantt chart. Support it with documentation and trackers that can help provide additional context so you can stay duly informed.
Can Be Challenging to Adjust and Maintain
As task lists grow, adjustments become more complicated without proper automation. Overlooking dependencies or failing to notice minor overlaps can cause a snowball effect on the rest of your project. This fact emphasizes the need for robust systems, processes, and checks and balances whenever you apply changes.
Gantt Chart Best Practices
Note Non-Working Days
Weekends and non-working holidays are vital considerations when plotting your work schedule. But they’re not the only non-working days you have to take note of.
Coordinate with your building administration and operations teams: Are there scheduled closures and maintenance services? Consider your office location: Are there days in the year where you frequently experience heavy rains or snow? Check-in with your teammates: do they have planned leaves and vacations for the year?
You can’t anticipate every work interruption. But with enough diligence, you can proactively prepare for the possibility of these external causes of delays.
Use Colors to Your Advantage
Colors can be easy to dismiss as superficial upgrades. But used well, they can help make your Gantt chart more readable and easier to use. Here are a few suggestions:
- Designate a color per milestone or deliverable so you can visually distinguish where your tasks connect to.
- Assign a color per person so your team can spot the tasks assigned to each of them at a glance.
- For easy reporting or troubleshooting, color each task according to its status (Example: Green if going well, yellow if it needs extra attention, red if it’s already overdue, etc.)
Adding dashes of color to your Gantt chart isn’t just good for aesthetic purposes. With the right system in place, they can add new layers of organization that you, your teams, or your stakeholders can benefit from.
Pick the Right Software
Maintaining a Gantt chart can be tedious, but it doesn’t have to be. The best way to manage this is by picking software that fits your needs.
Sorting, grouping, searching, and filtering should be hard requirements. Automation is a major plus. The right ones can make moving things around so much easier. Finally, consider how easy it is to learn and use.
With the right system and software in place, you can maximize your Gantt chart’s strengths and mitigate its weaknesses.
Conclusion
Gantt charts are powerful tools that are used across many industries. For marketing professionals, they provide a way to organize and align teams and projects.
At a glance, it can offer massive amounts of information such as tasks, estimates, assignments, milestones, dependencies, and progress. Ensuring that you have a sturdy system and tool its creation and maintenance can help you increase project visibility, improve productivity, and engage your team and stakeholders.
Workamajig has integrated Gantt charts and other project management features to help you stay on top of all your campaigns, teams, and initiatives.
Learn more about Workamajig’s project management tools to see how they can help you optimize your workflow and supercharge your productivity.
Request a free demo and get started today.
Related reads: