
As we step into 2022, what project management statistics should you be aware of? How is the PM field changing? We've compiled all the latest data in this article.
The field of project management is changing, and it’s changing fast. New tools, techniques, and frameworks are disrupting entrenched players and undoing long-held beliefs.
To prepare for these changes, you first need to arm yourself with hard facts. What is the exact rate of project failure? What are the underlying causes of failed projects? What makes for successful PMOs? And what kind of PM tools best fit your needs?
To answer these questions, we’ve compiled a comprehensive list of the latest project management statistics. With more than 50 data points culled from dozens of studies, this page is your de facto source for all things related to project management statistics.
Jump to one of the sections below to find relevant stats.

Project Management Adoption Statistics
What is the adoption rate of project management software across organizations? How do companies use formal training programs? What kind of PMOs do organizations employ?
Find answers to these questions, and more, below:
- Only 58% of organizations fully understand the value of project management. (PMI)
- 93% of organizations report using standardized project management practices. (PMI)
- 68% of organizations in PMI's annual survey said that they used outsourced or contract project managers in 2018. (PMI)
- Only 23% of organizations use standardized project management practices across the entire organization. 33% use standardized practices, but not across all departments. While a small portion - 7% - of organizations don't use any standard practices at all. (PMI)
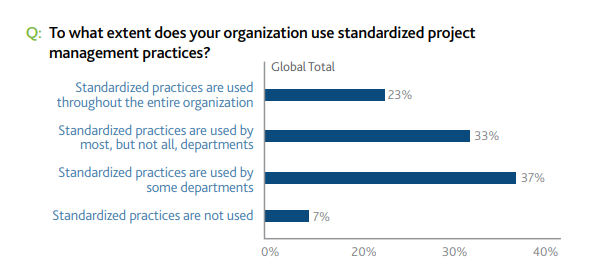
Organizations are often guilty of not using standardized PM practices, especially across the whole organization
- PM software adoption remains low. As per Wellingtone's survey, only 22% of organizations use a PM software. Coincidentally, 55% of organizations don't have access to real-time KPIs. As a result, 50% of respondents said that they spend one or more days manually collating project reports - highlighting the immense productivity gains on offer by using project management software. (Wellingtone)
- PM software adoption is changing, slowly but surely. Between 2017 and 2018, the percentage of organizations using spreadsheets to manage their agile projects dropped from 74% to 67%. Instead, these organizations moved to specialized PM tools. (VersionOne)
- 77% of high-performing projects use project management software. Despite its impact, adoption rates for PM software remain low (22% - see above). 66% of project managers say that they would use PM software more extensively if they had adequate support from their organization. (Hive)
- File sharing, email integrations, time tracking, Gantt Charts, and budget management are the top five most used and requested features in project management software. (Capterra)
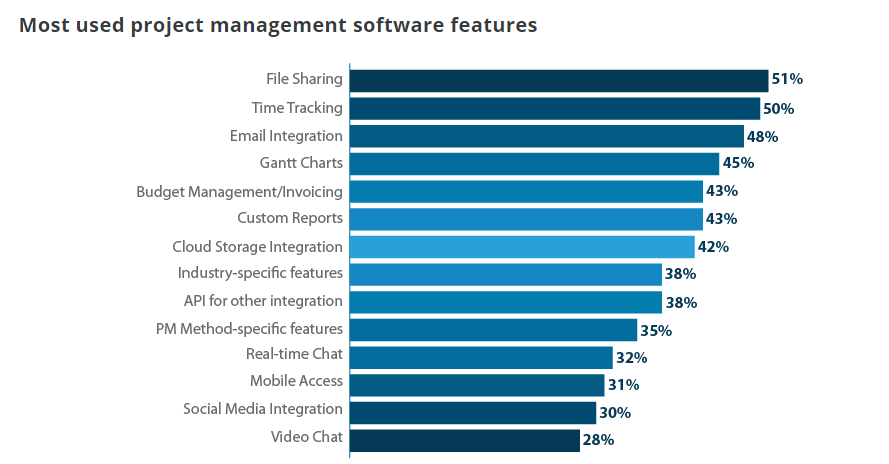
As this chart shows, social media and video chat are among the least-used PM features
- 56% of organizations have used only one project management system. On average, organizations spend $861/month on PM software. A majority - 54% - use on-premise PM software, though this is quickly changing. (Capterra)

Project Management Office (PMO) Statistics
As we wrote earlier, creating a project management office (PMO) can drastically improve productivity and bring greater clarity to your PM processes.
As these project management statistics show, creating a PMO can have substantial real-world benefits:
- Only 41% of organizations with an enterprise-wide project management office (EPMO) report that it is highly aligned with the organization's strategy. (PMI)
- PMO and EPMO: 80% of high-performance organizations - Champions - have a PMO. 72% say that there is a strong alignment of the EPMO to their organizational strategy. (PMI)
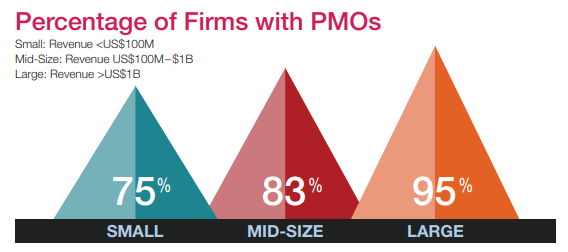
- Project management offices remain more popular among larger firms. 95% of large firms (>$1B revenue) reported having dedicated PMOs, either in specific departments or across the entire organization. In contrast, only 75% of small firms (<$100M in revenue) had dedicated PMOs. (PMSolutions)
Large businesses are far more likely to invest in PMOs than their smaller counterparts
- The value contributed by PMOs is on the up. In 2016, PMOs delivered a 33% improvement in projects delivered under budget, 27% improvement in customer satisfaction, 25% increase in productivity, and 25% reduction in failed projects. Altogether, PMOs led to $175k cost savings per project. (PMSolutions)
- PMOs are growing in both sizes (by budget and staff) and importance. In 2016, the average PMO accounted for nearly 5% of the project budget and had a staff size of 9. 49% of project managers report to the PMO (up from 42% in 2012). Incidentally, high-performance organizations had a far higher percentage of project managers reporting to the PMO than low-performing organizations - 68% vs 53%. (PMSolutions)
- It's not always a rosy picture for PMOs. 50% of respondents in a survey said that their biggest challenge is that PMO processes are seen as overhead. 42% said that their organizations are resistant to change and adopting new PM methodologies. 41% said that their biggest challenge is demonstrating the added value of the PMO. (PMSolutions)

Project Management Practices Statistics
Project management practices are rarely uniform across organizations. Different practices also yield variable results for different businesses.
In these project management statistics, we’ll look at the adoption of different PM practices:
- Risk management practices are widely used across most organizations - 27% say they 'always' use them, while 35% use the 'sometimes'. Only 3% of surveyed organizations say they 'never' use risk management practices. (PMI)
- Senior executives are often far more aware of the value of project management than rank and file members. Among senior leaders, 87% say that they "fully" understand the importance of PM practices. (PMI)
- Only 32% of organizations say that they're satisfied with their current PM maturity level. 67% would rank their department's PM maturity level at 3 or more (out of 5 levels). However, only 47% would rank their organization-wide PM maturity at level 3 or higher. This shows that there is a significant divide between department-level PM maturity and organization-level maturity. (Wellingtone)
- Strong support is a key ingredient of project success. In PMI's 2017 survey, 62% of successfully completed projects had sponsors who were actively supportive. 78% of respondents in a Geneca survey also said that they'd like business stakeholders to be more responsive and engaged in the project. Another study found that 33% of projects fail because of a lack of involvement from senior management. (PMI, University of Ottawa)
- A whopping 97% of organizations believe that project management is critical to business performance and organizational success, according to a PwC study. The same study also found that 44% of project managers use no software, even though using any popular commercially available PM software has been known to improve performance and project satisfaction. (PwC)
- Businesses say that the biggest impact of project management was on team communication (52%). 44% also said that it improved the quality of the final product, while 38% said that it improved customer satisfaction. 66% of respondents in Capterra's survey also said that they used project management software to communicate with clients. (Capterra)
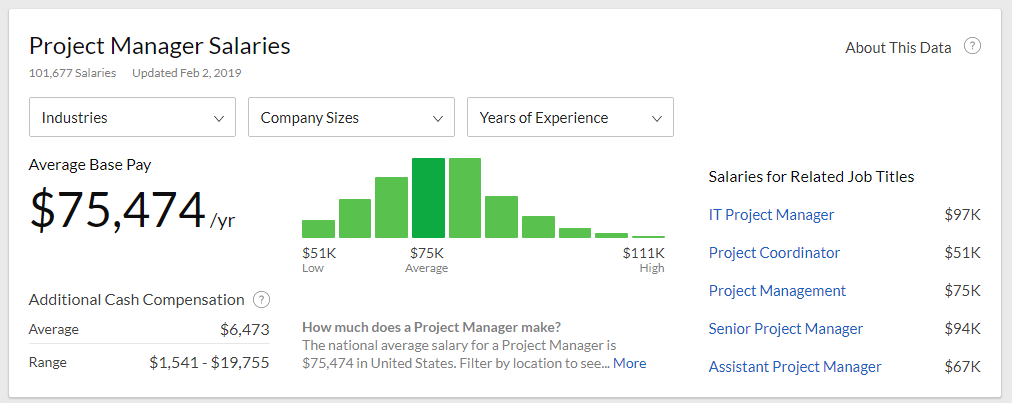
- As of February 2019, the average annual base salary for a project manager in the US is $75,474. PMs in the IT sector make substantially more - IT Project Managers take home an average of $97k in base pay. Additional cash components can vary a great deal, ranging from a low of $1,541/year to $19,755/year with an average of $6,473. At this average, the take-home pay for a project manager, on average, is in excess of $80k. (Glassdoor)
Experienced project managers can expect to make a lot of money, especially in major cities
- "Project Management" is a rather fluid role in most organizations. Only 42% of respondents in Wellingtone's survey that this role is occupied by a professional Project Manager in their organization. (Wellingtone)

Project Management Performance Statistics
What is the average failure rate of a project? Does the failure rate vary by project and industry? Among successful projects, what factors have the biggest impact on success?
We’ll answer some of these questions in the project management statistics below.
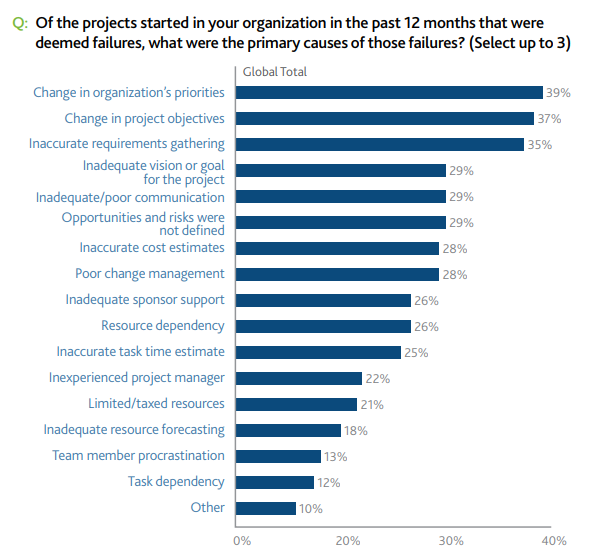
- The top five causes of project failure are:
- Change in the organization's priorities (39%)
- Change in project objectives (37%)
- Inaccurate requirements gathering (35%)
- Inadequate vision (29%)
- Poor communication (29%).
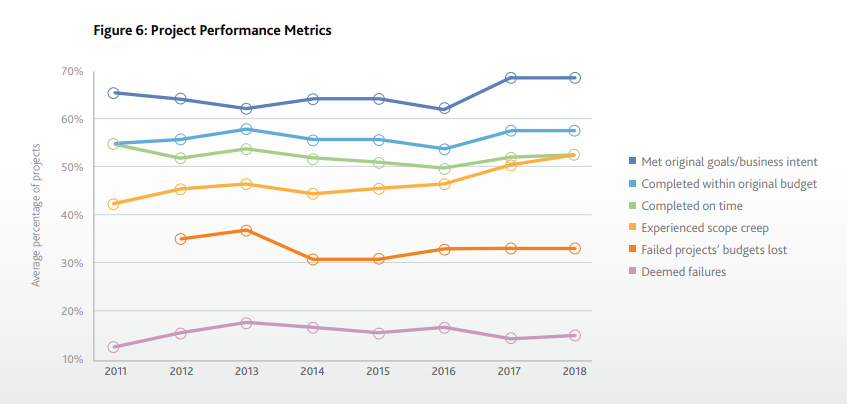
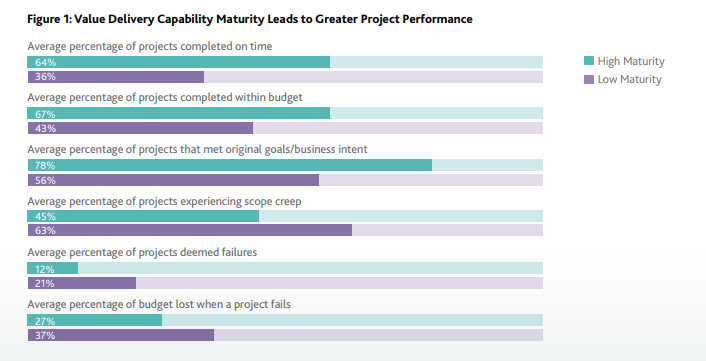
- Project performance has been rising globally. In 2018, nearly 70% of projects met their original goals or business intent, while nearly 60% were completed within the original budget. Both these figures are up from 62% and 50% respectively in 2016. (PMI)
- Compared to 2017, 71% of organizations reported a lack of funding as their top project management challenge, while 49% more organizations reported an inconsistency in approach. (Wellingtone)
- IT projects are notoriously difficult to manage. A survey published in HBR found that the average IT project overran its budget by 27%. Moreover, at least one in six IT projects turns into a "black swan" with a cost overrun of 200% and a schedule overrun of 70%. In other words, while most IT projects will fall short of their budget targets, a few might overshoot the targets so much as to cause catastrophic organization-wide problems. KMart's massive $1.2B failed IT modernization project, for instance, was a big contributor to its bankruptcy. (HBR)
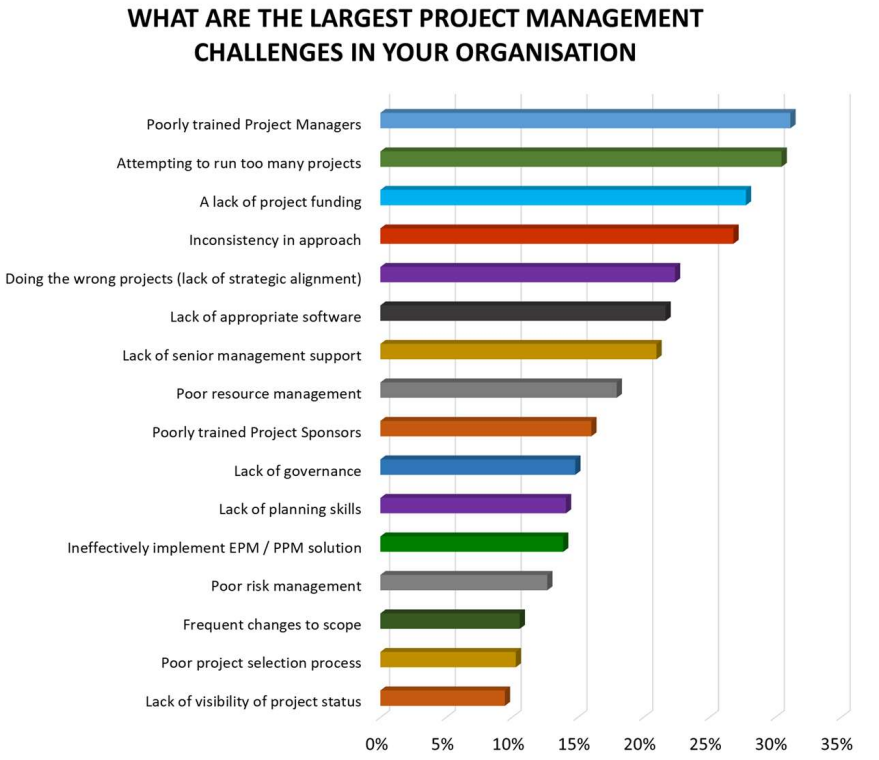
- Poorly training project managers, attempting too many projects, and a lack of project funding are the top three project management challenges in Wellingtone's survey. (Wellingtone)
- Among IT projects, failure rate corresponds heavily to project size. An IT project with a budget over $1M is 50% more likely to fail than one with a budget below $350,000. For such large IT projects, functionality issues and schedule overruns are the top two causes of failure (at 22% and 28% respectively). (Gartner)

- A PwC study of over 10,640 projects found that a tiny, tiny portion of companies - 2.5% - completed 100% of their projects successfully. The rest either failed to meet some of their original targets or missed the original budget or deadlines. These failures extract a heavy cost - failed IT projects alone cost the United States $50-$150B in lost revenue and productivity. (Gallup)
- Investing in proven PM processes and methodologies pays off. According to CIO, organizations that use proven PM practices waste 28x less money than their more haphazard counterparts. (CIO)
- Rework is a big cause of project failure and a significant source of delays. 80% of respondents in a Geneca survey said that they spend half their time on rework. (Geneca)
- Poor stakeholder-project manager alignment is a big cause of project failure. Only 55% of people involved in projects - team leaders and project managers - feel that the project's business objectives are clear to them. More than 80% also feel that the requirements process doesn't articulate the needs of the business. And when the project is wrapped up, only 23% of respondents say that project managers and stakeholders are in agreement when a project is done. (Geneca)
- To give you an idea of the abysmal success rate of most projects, only 40% of projects at IBM meet the company's three key goals - schedule, budget, and quality. (IBM)
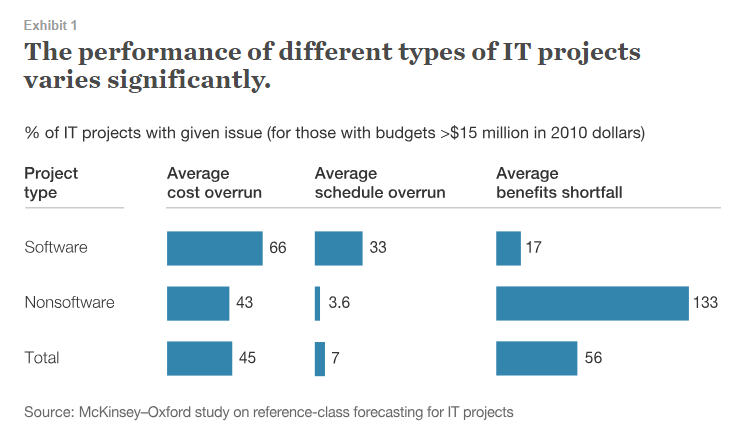
- Among IT projects, project performance varies significantly. While software projects have an average cost overrun of 66%, the same figure for non-software projects is 43%. However, 133% of non-software projects fail to meet their stated benefits, compared to just 17% for software projects. (McKinsey)
- 17% of IT projects can go so bad that they can threaten the very existence of the company. (McKinsey)
- Overall, 76% of users say they are either "very satisfied" or "satisfied" with their decision to use project management software. The biggest reason for any dissatisfaction remains price (56%), followed by a lack of features (33%). (Capterra)
- 64% and 67% of projects with high maturity of PM processes are delivered on time and within budget, respectively. The equivalent figures for low-maturity organizations are just 36% and 43%. (PMI)
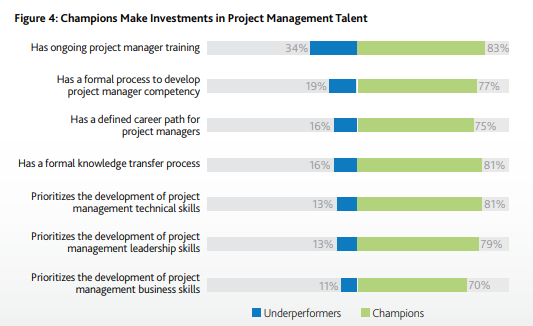
- 83% of high-performance organizations (i.e. 'Champions') make an ongoing investment in project management training. 77% of such organizations have formal processes to develop PM competency. In contrast, only 34% of underperformers offer similar training. (PMI)

Project Management Training Statistics
A sure shot way to improve project performance is to invest in intensive training. This includes training for PM fundamentals as well as ancillary skills related to project management - leadership, communication, soft skills, etc.
We’ll look at some project management statistics related to training below.
- Soft skills are increasing in importance for project managers. 51% of respondents in PMI's 2018 survey said that soft skills are more important today, while only 19% said that this skill requirement is unchanged. (PMI)
- Technical and leadership skills remain the most important priorities for top-performing organizations. 81% of these organizations prioritize the development of technical skills (vs 13% of underperformers), 79% prioritize leadership skills, and 70% focus on developing strategic and business management skills. (PMI)
- Despite low maturity levels, only 48% of organizations have invested in accredited project management training. 15% use non-accredited training or courses, while more than 25% don't invest in any training at all. (Wellingtone)
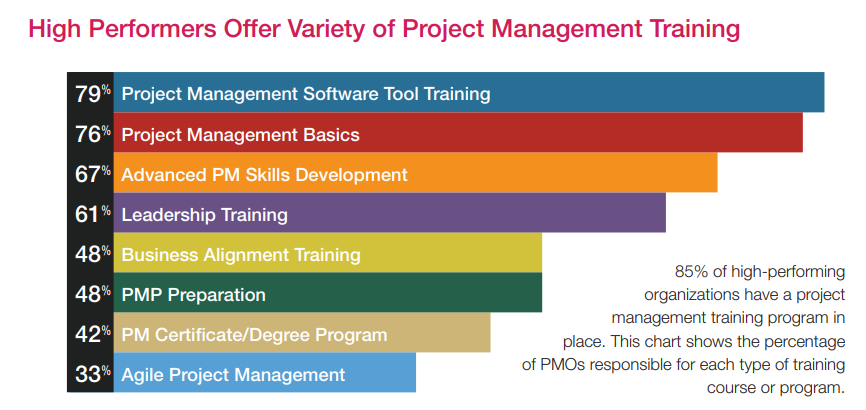
- The success of the PMO often lies in its approach to training. 60% of PMOs now have a formal project management training program, up from 11% in 2014. Incidentally, high-performing organizations are far more likely to have a training program than low-performers (85% vs 38%). On average, these organizations spent 5 days per year in training. (PMSolutions)
- Most PMOs (79%) offer onsite, classroom-based training using in-house trainers. However, a significant - and growing - number (51%) are now relying on external trainers for onsite classes as well. Larger organizations are also more likely to use on-demand, online training. (PMSolutions)
- High-performing organizations use a variety of PM training strategies. 79% use PM software tool training, 76% offer training on PM basics, 67% offer advanced PM skills development, and 61% offer leadership training. (PMSolutions)
Sources:
- State of the PMO in 2016, PM Solutions
- PMI: Pulse of the Profession 2018, Project Management Institute
- Delivering large-scale IT projects on time, on budget, and on value, McKinsey
- Why up to 75% of software projects will fail, Geneca
- Project manager salary, Glassdoor
- Survey shows why projects fail, Gartner
- Project management guide: Tips, strategies, best practices, CIO
- Project management user research report, Capterra
- The cost of bad project management, Gallup
- Why your IT project may be riskier than you think, Harvard Business Review
- 11th annual State of agile report, VersionOne
- The state of project management: Annual survey 2018, Wellingtone
- Making change work, IBM
- PwC global project management report 2012, PwC
- PMI: Pulse of the Profession 2017, Project Management Institute
- A replicated survey of IT software project failures, University of Ottawa
Over to you
There you have it — the complete list of the latest project management statistics in 2022. Use it to understand the project management landscape, benchmark your own success rate, and understand how others are using project management practices and tools.
If you’re ready to standardize your own approach to project management, try using PM software like Workamajig. See how it can benefit your business by requesting a free demo.
Related reads: