

Accurately tracking project profitability is something many service businesses struggle with, but creative agencies have an especially hard time due to their unique workflows. You’re dealing with multiple revisions, complex feedback processes, subjective opinions, and jobs that aren’t easy to estimate in terms of effort (how long should you allocate for brainstorming?).
All these variables mean that there are even more chances of your project’s profitability going off course. Resources spending more time than you budgeted for on rework, unplanned vendor costs, and rogue change requests can all eat into your margins. The worst part is that many teams don’t know if their projects are profitable until post-mortem.
That’s why tracking project profitability is about more than just managing reconciliation and looking back after wrap. What creative agencies really need is a system that sets their projects up for success and lets them monitor real-time profitability projections every step of the way.
Our guide is designed to help you out with all of this — it covers:
- Everything you need to know about how project profitability is calculated, including key metrics and formulae.
- The 5 main steps for tracking and improving project profitability, plus a workbook that you can use for it.
- Our complete system (Workamajig) goes beyond just tracking profitability, providing agencies with all the tools they need to protect their margins and boost their bottom line.
Project Profitability Metrics & Formulae
We’ve included the most common metrics for tracking project profitability below, along with formulae for calculating them and worked examples.
Gross Profit Margin
Gross profit margin is the quickest sanity check on a project — how much is left once the direct cost of doing the work is covered, before overhead enters the picture.
|
Formula: Gross Profit Margin = (Revenue − Direct Costs) / Revenue × 100 |
|
Direct Costs = Internal Labor + Contractor Labor + Software/Tools + Cloud/Infrastructure + Travel + Third-Party Services (everything that wouldn't exist if the project didn't exist). |
Worked example:
- Revenue (contract value): $450,000
- Direct costs: $273,300
- Gross Profit Margin = ($450,000 − $273,300) / $450,000 = 39.3%
Net Profit Margin
Net profit margin is the more complete number — what's actually left after overhead is allocated. It's almost always lower than gross margin, sometimes more than people expect.
|
Formula: Net Profit Margin = (Revenue − Total Costs) / Revenue × 100 |
|
Total Costs = Direct Costs + Allocated Overhead (management time, office costs, shared tools/software) |
Worked example:
- Revenue: $450,000
- Total costs (incl. $21,500 overhead allocation): $294,800
- Net Profit Margin = ($450,000 − $294,800) / $450,000 = 34.5%
So the ~5-point gap between gross (39.3%) and net (34.5%) margins is entirely due to overhead.
Sample Data: For Worked Examples
The table below outlines a design team’s billable rates, cost rates, and a breakdown of their hours. We’ll reference this table throughout the examples below to show you how different metrics are calculated and how you can interpret the results.
Table 1: The Design phase team
|
Name |
Role |
Type |
Cost Rate (what it costs the agency) |
Bill Rate (what's on the rate card) |
|
Maya Chen |
Senior Designer |
Internal |
$95/hr |
$195/hr |
|
Jordan Reyes |
Mid-Level Designer |
Internal |
$75/hr |
$165/hr |
|
Sam Okafor |
Motion Designer |
Contractor |
$100/hr |
$200/hr |
Table 2: Hours breakdown
|
Name |
Budgeted Hours |
Actual Hours Worked |
Billable Hours |
Chargeable Hours (post write-off) |
|
Maya Chen |
80 |
92 |
85 |
78 |
|
Jordan Reyes |
100 |
96 |
90 |
90 |
|
Sam Okafor |
47 |
40 |
40 |
40 |
Maya ran 12 hours over budget and had 7 hours written off for rework. Jordan came in slightly under budget with nothing written off. Sam (the contractor) finished early with a clean bill — everything logged was billable and chargeable.
Chargeability
Chargeability measures the percentage of billable hours that are actually chargeable to a client — after write-offs, redos, and scrubbed time. So it offers a more accurate perspective on what each resource is bringing in than billable utilization does.
For ongoing projects, chargeability is harder to pin down in real time (you can't predict future write-offs or rework). But tracking it periodically — say, each quarter — gives you a reliable snapshot of how much of your team's effort is actually converting to revenue, and where the leaks are. Over time, you can collect more data to set realistic chargeability targets by role and project type.
|
Formula: Chargeability = Chargeable Hours / Billable Hours × 100 |
Table 3: Chargeability by resource
|
Name |
Chargeable Hours |
Billable Hours |
Chargeability |
|
Maya Chen |
78 |
85 |
91.8% |
|
Jordan Reyes |
90 |
90 |
100% |
|
Sam Okafor |
40 |
40 |
100% |
|
Blended (Design phase) |
208 |
215 |
96.7% |
So while the blended number (96.7%) looks healthy on its own, it’s carrying Maya’s rework — and because she’s billed at a senior rate, those written-off hours cost more margin than the same hours would from a junior resource.
Rate Realization
Rate realization shows how much of a resource's rate card actually converts to revenue once write-offs and discounting are factored in. It's often the first place to look when chargeability seems fine, but profit margins don’t.
|
Formula: Rate Realization = (Chargeable Revenue / Hours Worked) / Standard Bill Rate × 100 |
|
Chargeable Revenue = Bill Rate × Chargeable Hours |
Table 4: Rate realization by resource
|
Name |
Chargeable Revenue |
Hours Worked |
Realized Rate/Hr |
Standard Bill Rate |
Rate Realization |
|
Maya Chen |
$195 × 78 = $15,210 |
92 |
$165.33 |
$195 |
84.8% |
|
Jordan Reyes |
$165 × 90 = $14,850 |
96 |
$154.69 |
$165 |
93.8% |
|
Sam Okafor |
$200 × 40 = $8,000 |
40 |
$200.00 |
$200 |
100% |
Sam realizes 100% of his rate card — every hour worked converted straight to chargeable revenue at the full rate. Maya realizes only 84.8% — her overrun and write-offs mean a meaningful chunk of her (expensive) time never converted to revenue.
Labor Gross Margin
Labor gross margin specifically evaluates the profitability of your labor — usually an agency’s single biggest cost category — so it can catch one resource dragging down margin in a way a blended, project-level number won’t always highlight.
|
Formula: Labor Gross Margin = (Labor Revenue − Labor Cost) / Labor Revenue × 100 |
- Labor Revenue = Bill Rate × Chargeable Hours (same as Chargeable Revenue above)
- Labor Cost = Cost Rate × Actual Hours Worked
Table 5: Labor gross margin by resource
|
Name |
Labor Revenue |
Labor Cost |
Margin ($) |
Labor Gross Margin |
|
Maya Chen |
$15,210 |
$95 × 92 = $8,740 |
$6,470 |
42.5% |
|
Jordan Reyes |
$14,850 |
$75 × 96 = $7,200 |
$7,650 |
51.5% |
|
Sam Okafor |
$8,000 |
$100 × 40 = $4,000 |
$4,000 |
50.0% |
|
Blended (Design phase) |
$38,060 |
$19,940 |
$18,120 |
47.6% |
But if every hour had gone exactly to budget (fully billed, nothing written off), labor gross margin would have been:
|
Budgeted Labor Revenue |
Budgeted Labor Cost |
|
|
Maya Chen (80 hrs) |
$195 × 80 = $15,600 |
$95 × 80 = $7,600 |
|
Jordan Reyes (100 hrs) |
$165 × 100 = $16,500 |
$75 × 100 = $7,500 |
|
Sam Okafor (47 hrs) |
$200 × 47 = $9,400 |
$100 × 47 = $4,700 |
|
Total |
$41,500 |
$19,800 |
|
Budgeted Labor Gross Margin = |
So comparing the planned 52.3% vs. actual 47.6%, there’s an almost 5-point variance, driven almost entirely by Maya’s overrun and write-offs (notice her individual margin, 42.5%, is the lowest on the team despite being billed at a senior rate).
5 Steps to Track & Measure Project Profitability
Agencies that consistently deliver profitable projects don’t rely on luck. They have the right systems in place to build project plans with accurate estimates, monitor progress, catch issues early, evaluate performance, and apply their learnings to future planning. We’re going to walk you through everything they do in this section, broken down into 5 simple steps.
We’ve also created a project profitability-tracking workbook (works in Excel & Google Sheets) that you can use to implement these steps. You can download it here.
1. Establish a baseline budget & revenue plan through estimates
Starting with an accurate estimate is one of the most important steps to ensure your project crosses the finish line with a healthy profit margin. The right baseline gives you a reference point for negotiating pricing with the client and tracking profitability as the project progresses. Your estimate should account for:
- Direct costs — including labor, contractors, tools, vendor costs, and expected out-of-pocket expenses (e.g., travel). If you can plan these costs by project phase, that’ll help you track profitability and catch issues as the project progresses.
- Revenue and billing structure— decide upfront how the engagement will be billed (fixed fee, time-and-materials, retainer, or milestone-based) and lock in the invoicing schedule. This determines when revenue actually hits relative to costs, which affects how profitability appears on your books as the project progresses.
- Scheduled project start and end dates — these are important because if your project takes longer than anticipated, costs (especially labor) will naturally increase.
- Contingency and management reserve layers — not every project goes exactly to plan, and your estimate should account for that. A contingency buffer covers known risks within the project scope — things like a round of revisions running long or a vendor coming in slightly over quote. Management reserve covers unknowns you can't see coming.
- Target profit margin — when you’re setting up the baseline, make sure you have a clear target margin upfront (e.g., 40% gross margin), so you’ve got something to track variances against as the project progresses. It also means you have a decision-making framework when trade-offs come up mid-project: if a client requests additional scope, you can evaluate whether absorbing it keeps you above your target or pushes the project below the threshold where it's worth doing.
The most effective way to increase the accuracy of your estimates is to track and organize project expenses over time, so you have historical data to reference.
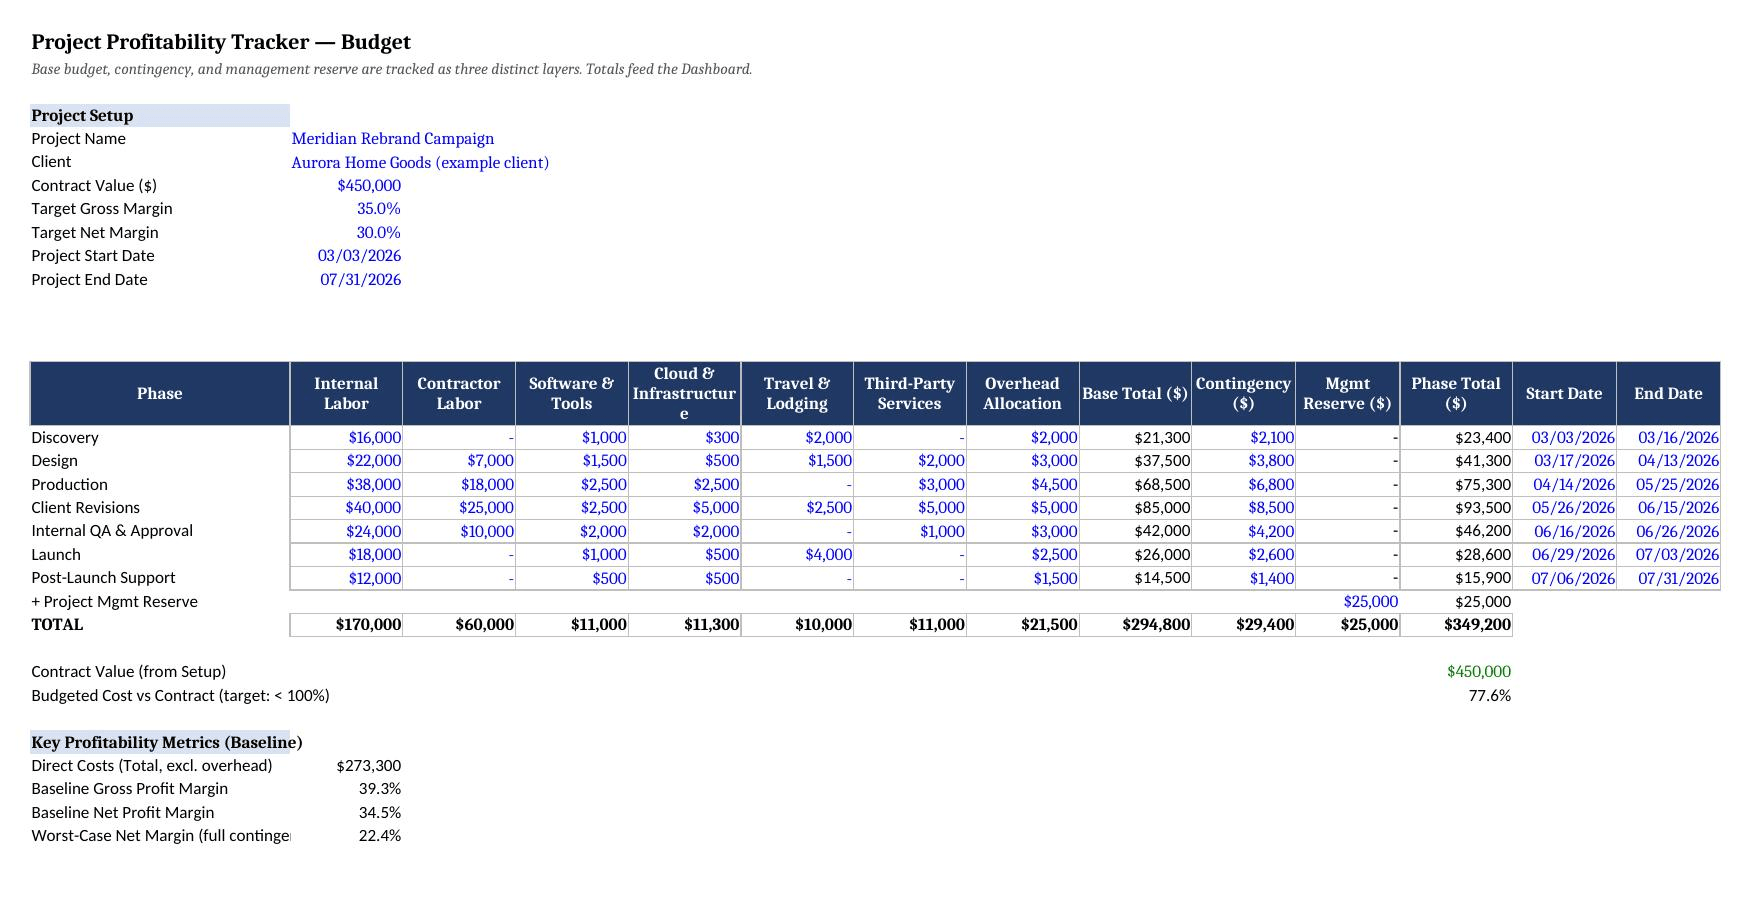
Example: Baseline budget setup, with cost categories, contingency/reserve layers, target margins, and phase scheduling.
Read more: The Creative Agency Guide to Creating a Project Budget
2. Track time & expenses
Now that you’ve got an initial baseline, the next step is to track how well things hold up as the project progresses. Are your costs staying near the estimate, or are they higher or lower? What does this mean for project profitability? To answer these questions, you’ll need to monitor the project’s actuals — i.e., the labor and non-labor costs that accrue.
Time tracking
From a profitability perspective, time tracking isn’t something you can afford to miss for two main reasons:
- First, it shows you where each resource's time — and cost — is actually going. Every logged hour carries a person's cost and bill rate, so tracking time is key to understanding the financial impact of each resource’s efforts: which tasks and projects are consuming hours, and what is that time costing you.
- Second, it ensures all billable work is captured. Any billable work that goes under the radar and doesn't make its way onto a client invoice is lost revenue for your agency.
But to accurately tie project activities to downstream metrics — such as profit, labor gross, and billable utilization — you need everyone to track their time at the task level.
That’s where things get tricky. People don’t really love to track their time, especially when it pulls them away from the work they’re doing. And neither spreadsheets nor time tracking apps let you do this efficiently. Everyone has to manually enter their hours, managers have to tie those hours back to specific project activities, and teams have to tally labor costs against budgets as projects progress. It’s tedious, and you don’t have real-time data for your live projects.
That’s why the best option is agency time-tracking software that lets people track time where they work — so they don’t have to switch between tools or remember to submit their hours. These tools automatically tie hours to project activities and give managers control over how those hours are handled. They can approve, edit, and write off entries as needed.
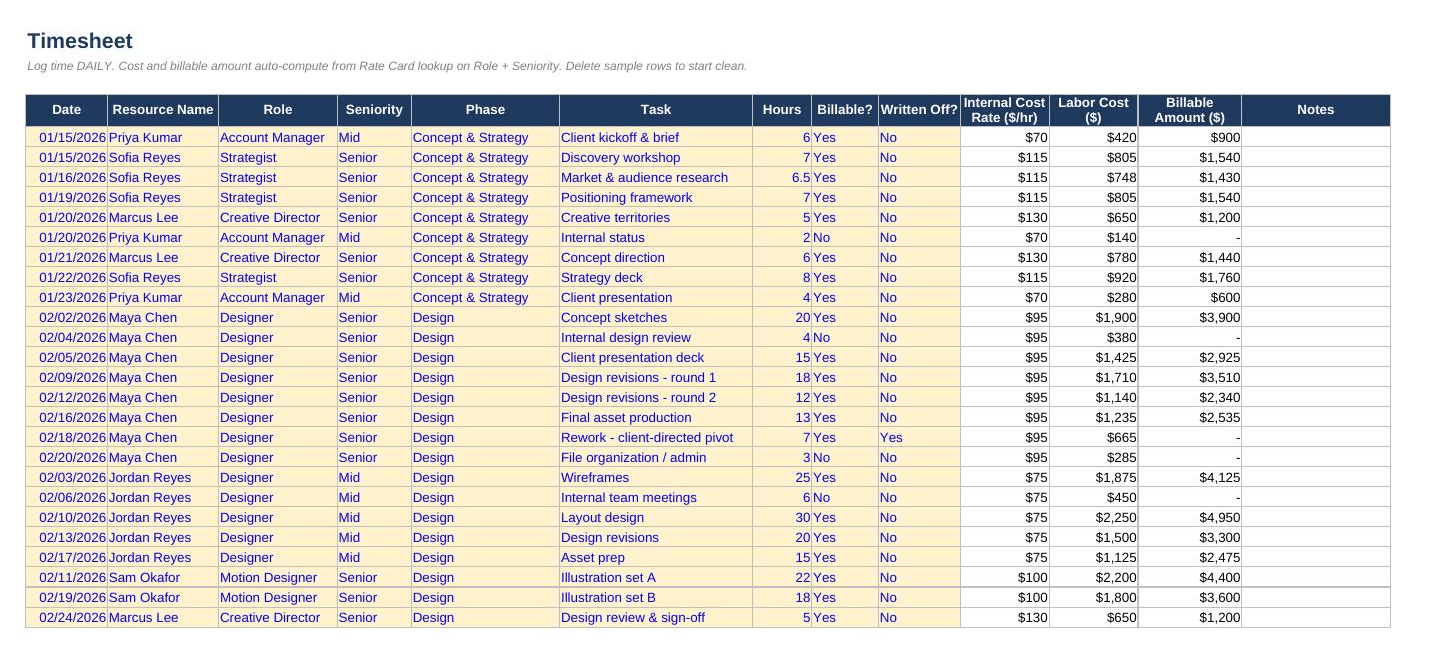
Example: Task-level time log, with billable/chargeable status and write-offs documented.
Non-labor expense tracking
Managing non-labor expenses comes with its own set of operational challenges — teams must track and organize them, factor them into project budgets, reconcile them, and maintain audit logs.
Many agencies initially track project expenses with spreadsheets, but the setup requires loads of manual effort — you’ve got to define expense categories, build in time tracking, set formulas for things like budget burn and variance, and then work in dashboards, controls, and reporting.
To make things easy for you, we’ve included a dedicated project expense-tracking section in the workbook we shared earlier. And while it’s a good place to start, keep in mind that spreadsheets just don’t hold up well as your operations scale, and you take on more complex projects.
Another thing that spreadsheets don’t really tackle — which is super important for profitability tracking — is reconciliation and revenue recognition. Agencies usually manage these accounting tasks in a standalone system such as QuickBooks or Xero, which involves more manual work and can lead to data entry errors. That’s why many growing agencies graduate to all-in-one systems that let them track finances within project workflows and manage accounting in the same place.
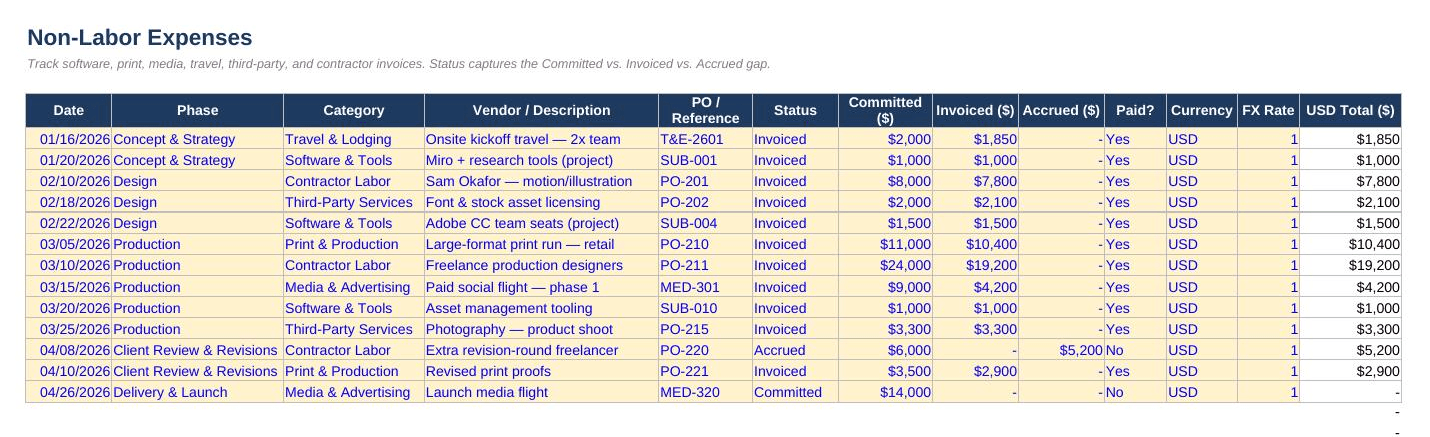
Example: A project expense-tracking template illustrating manual expense categories and budget-variance formulas.
Read more: Project Expense Tracking: Practical Steps, Tips, & Tools
3. Monitor budget burn, utilization, & scope creep
After your projects go live and everyone’s tracking their actuals, managers need to keep comparing what’s happening on the ground against their initial plans and take appropriate actions: updating their projections, making strategic calls, and negotiating with clients as needed.
At the high level, start by monitoring each project’s current budget — the one that reflects actual hours and incurred costs — against the initial estimate. This view alerts you to any issues as the project progresses, so you can investigate further and correct course when necessary.
For example, let’s say project A has completed phase 1 as expected (in terms of planned costs and timeline), but is at risk of running over in phase 2. The dashboard alerts you to the variance, and then you can investigate further by pulling up a breakdown of actual vs. estimates to see what’s contributing to the overruns. Is a vendor invoicing you for significantly more than they quoted? Are designers spending far more time on tasks than you had allocated for them?
We also recommend setting up cost and margin thresholds — both phase-wise (when possible) and at the project level — that automatically notify you when a project crosses, say, 80% of its budgeted hours or the allocated budget dollar amount. Agencies and creative teams often set thresholds for specific project elements (design, copywriting, development) and resource categories (internal labor, contractors, materials), too.
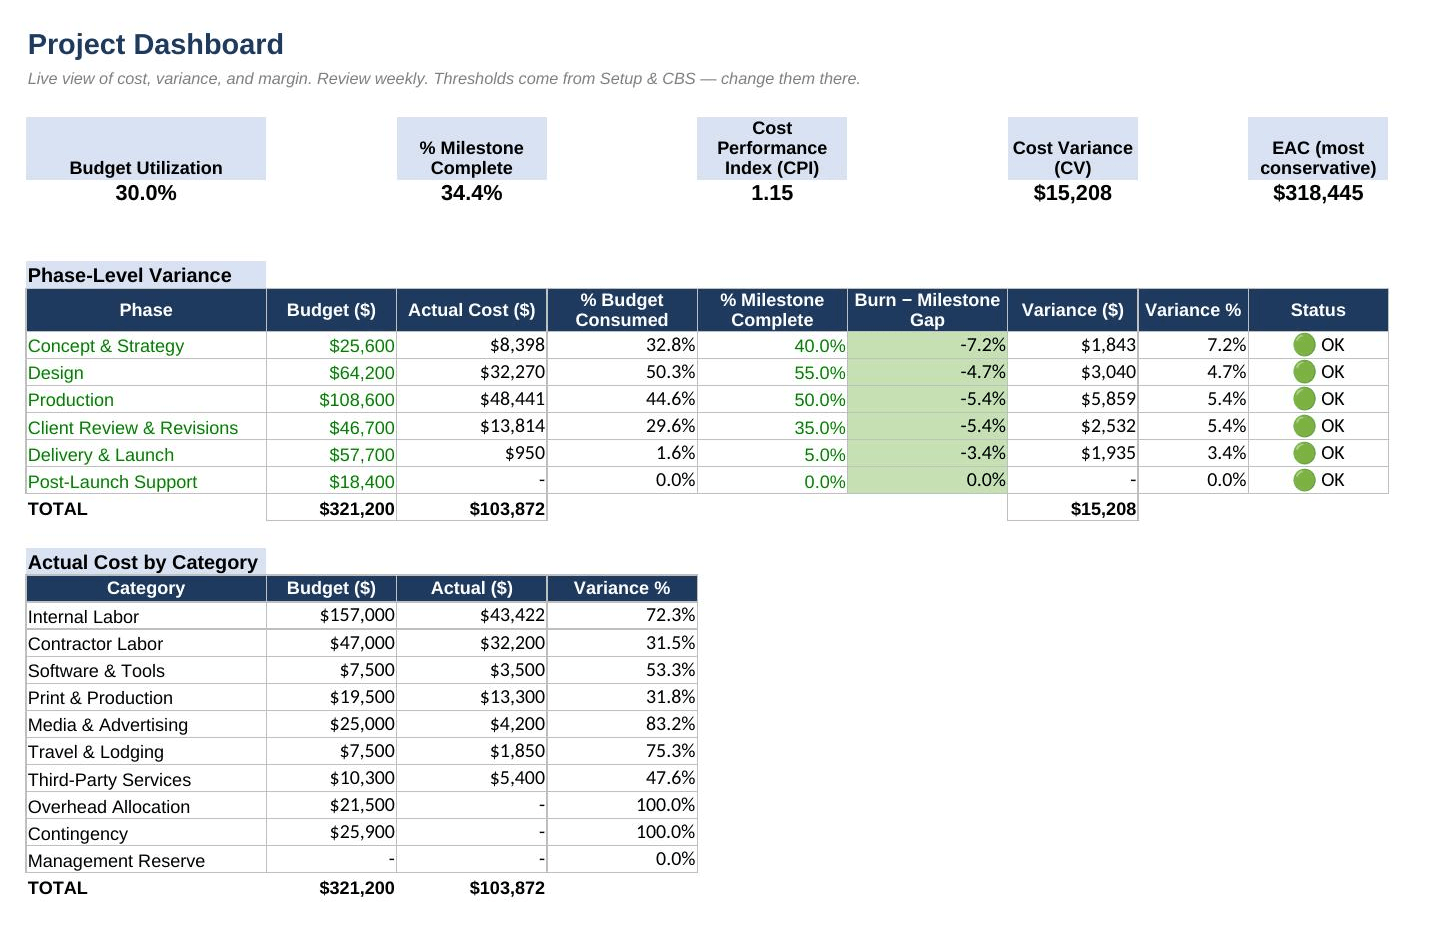
Example: A project monitoring dashboard with phase-level variances and actuals vs. budget breakdowns.
4. Calculate profitability from different perspectives
Tracking project profitability is important to ensure that the work you deliver is actually making money. But going deeper — or broader — helps you answer questions like: Who are your most profitable clients? Are any service lines unprofitable overall? What’s the profitability of each team member?
![Post-Mortem: Final Actuals vs Original Budget [V2]](https://www.workamajig.com/hs-fs/hubfs/Post-Mortem%20%7C%20Final%20Actuals%20vs%20Original%20Budget%20-%20V1.png?width=1190&height=546&name=Post-Mortem%20%7C%20Final%20Actuals%20vs%20Original%20Budget%20-%20V1.png)
Example: A high-level view of project-level profitability, with phase-wise cost breakdowns.
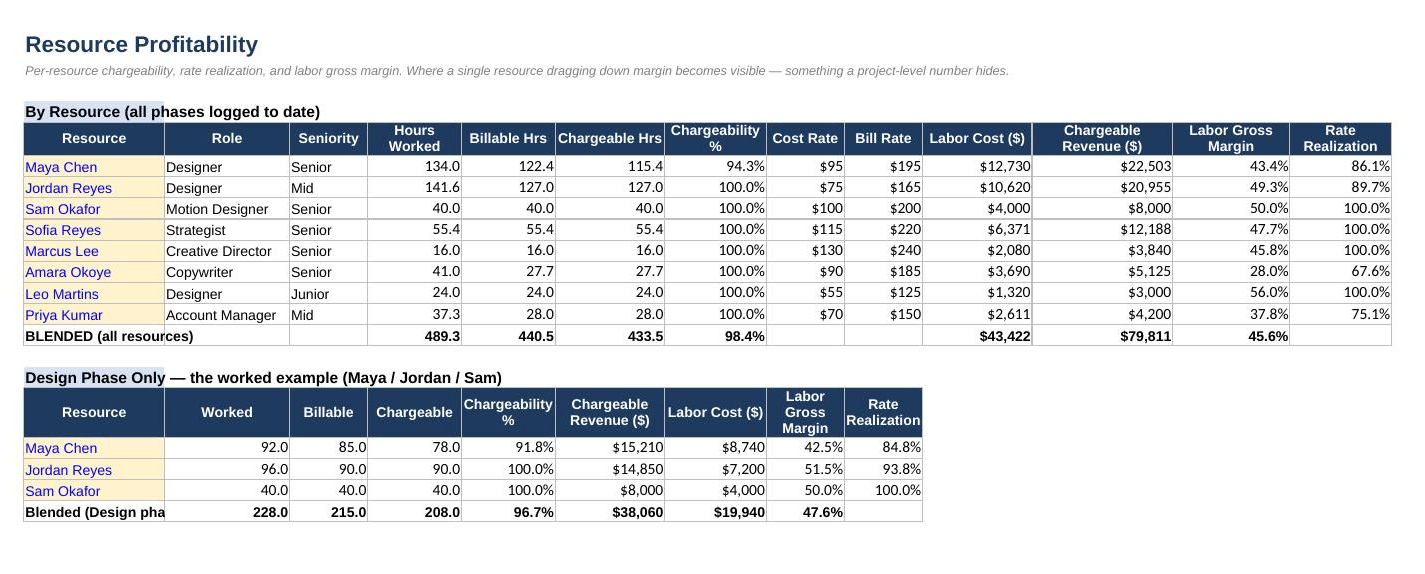
Example: A breakdown of the profitability of all resources allocated to the project.
Getting answers to these questions can help you make the right strategic calls. For example:
- Maybe one project has a low margin, but the client P&L shows healthy profitability for that account overall. So while the project may not be a rainmaker, it might be worth it anyway to keep an important client happy.
- Maybe a specific service line isn’t very profitable overall. You might consider repricing it, switching up the resource composition, changing what’s included, or axing the service altogether.
5. Close the loop after project wrap
Applying what you’ve learned from previous projects to future plans is one of the most important steps for improving your bottom line. So after you’ve run those post-mortem reports, don’t sign off yet; see which estimates were off, what mistakes were made, who performed well — and see what needs to change going forward.
You can do this by comparing final actuals against the original baseline and the current (post-change order) budgets from different perspectives — e.g., at the project, task, and resource levels — and investigating any variances.
![Post-Mortem: Final Actuals vs Original Budget [V2]](https://www.workamajig.com/hs-fs/hubfs/Post-Mortem%20%7C%20Final%20Actuals%20vs%20Original%20Budget%20-%20V2.png?width=1639&height=695&name=Post-Mortem%20%7C%20Final%20Actuals%20vs%20Original%20Budget%20-%20V2.png)
Example: A post-mortem project profitability with actuals compared to estimates.
For example, the post-mortem report above compares each phase's original budget and approved change orders to its final actuals, with a root cause note for each variance. It shows that the project closed with a 24.2% net margin — more than 10 points below the 34.4% planned at baseline — due to significant overruns in two stages. So, although Client Review & Revisions stayed nearly on budget (its two extra rounds were priced as change orders before the work began), and every other phase came in on or under, the project didn’t perform as well as expected.
Here’s more on what contributed to the overruns and how these findings can be used to improve future planning:
- Production ran $12,200 (11.5%) over its revised budget because the print vendor billed 15% above their quote and a contractor's work required extensive rework. Some future actions to consider here are: renegotiating that vendor's rate, lining up a backup supplier, and weighing that contractor's rate against the rework it created. What was their effective cost per usable hour? Would a mid-level in-house designer be more cost-effective?
- Design ran $8,500 (13.6%) over because revisions consistently took around 40% longer than budgeted. So that indicates either the estimates were too low or you need a tighter change management process to keep scope creep in check.
Similarly, analyzing profitability at the resource level might uncover other gaps. Maybe a particular employee has a track record of being slow on specific tasks — so you might give them different jobs in future projects. Or, if a particular team structure has led to poor project profitability in the past, consider adopting a different one.
Common Pitfalls in Project Profitability Tracking
Watch out for these common pitfalls that can get in the way of accurately tracking profitability:
- Relying on budgeted costs instead of actuals. Estimating profitability off planned budgets rather than actuals hides overruns until it's too late to course-correct.
- Neglecting indirect/overhead cost allocation. Including only direct costs (labor, vendor costs, transaction costs, materials) in your calculations while ignoring allocated overhead (administrative expenses, operational costs, rent, tools/software) makes projects appear more profitable than they are.
- Mistiming revenue recognition vs. cost recognition. If costs are recorded as incurred but revenue is recognized on a different schedule (this often happens with milestone-based or percentage-of-completion billing), profitability can appear distorted mid-project.
- Lacking a process that keeps change requests in check. Without a formal change management process, those “just one more thing” requests can quickly spiral, causing scope creep and digging into your margins. This is one of the most common — and most preventable — profitability killers in project-based work.
- Not accounting for how the contract is set up. For example, while profitability tracking for fixed-price projects requires comparing actual costs to a fixed revenue ceiling, time-and-materials projects follow a different logic in which revenue scales with hours.
- Only evaluating profitability at project wrap. Waiting until the project ends to evaluate profitability means you don’t have any time to change its fate. Real-time or milestone-based tracking is needed to catch overrun risks before it's too late to intervene (e.g., renegotiate scope, reallocate project resources).
- Not accounting for resource cost differences. Using a blended or average hourly cost rate across all staff on a project (rather than each person's actual cost) can distort margins — especially on projects with a mix of senior and junior staff or on-shore and off-shore resources.
- Neglecting billable utilization and chargeability. Excluding rework, internal meetings, and non-billable client management time from profitability calculations inflates the apparent margins.
- Lacking a consistent definition of "project profitability" across the org. If different teams or systems calculate margin differently (some include overhead, some don't; some use budgeted cost, some use actual), then you can’t compare profitability across different projects. So your whole team needs to agree on a singular definition and apply it across all reporting.
The biggest move you can make to prevent all of these pitfalls is to adopt the right software. A fully integrated project and financial management system provides all the tools you need to manage different engagements, track costs, optimize resource allocations, and improve profitability.
How Workamajig Lets You Track & Improve Project Profitability with Real-Time Data
Workamajig is an all-in-one system we designed specifically to help agencies address their profitability challenges. It’s one of the only systems that combines creative project management software with accounting software, allowing agencies to manage finances within their project workflows and accurately track profitability at each stage.
Our system offers dedicated tools for generating accurate estimates, tracking time and tying hours to project activities, capturing and managing different expense types, monitoring project budgets and health, catching overruns before they snowball, managing change requests, recognizing revenue, and reporting on profitability, utilization, and productivity.
With all these features under one roof, agencies can move off scattered systems and spreadsheets and manage all their projects, people, clients, and finances in one place.
1. Establish a project budget with accurate estimates
Workamajig makes it easy to generate an accurate estimate using relevant historical and current data stored in our system. For example, it pulls in vendor costs, hourly employee rates, media-buying costs, and costs from similar projects that your agency has previously delivered. Our system offers three main ways to build out these estimates.
- Using project templates. If you’re kicking off a project that’s similar to a previous one — maybe it’s from the same service line — then our templates offer a great foundation to work with. Each one stores both project details (milestones, tasks, subtasks, dependencies, resource allocations) and estimates. So project managers only have to make a few tweaks — editing line items, marking things up or down, adding expenses or services — to match the new project’s scope and requirements.
- Using the project’s schedule. If you’ve mapped all the project’s details out — tasks, allocations, start and end dates, etc — then Workamajig lets you automatically generate an accurate labor estimate based on the schedule. Also, any changes you make to the estimate (e.g., tweaking task hours) get pushed back into the schedule, and vice versa, so you don’t have to manually update both every time something changes.
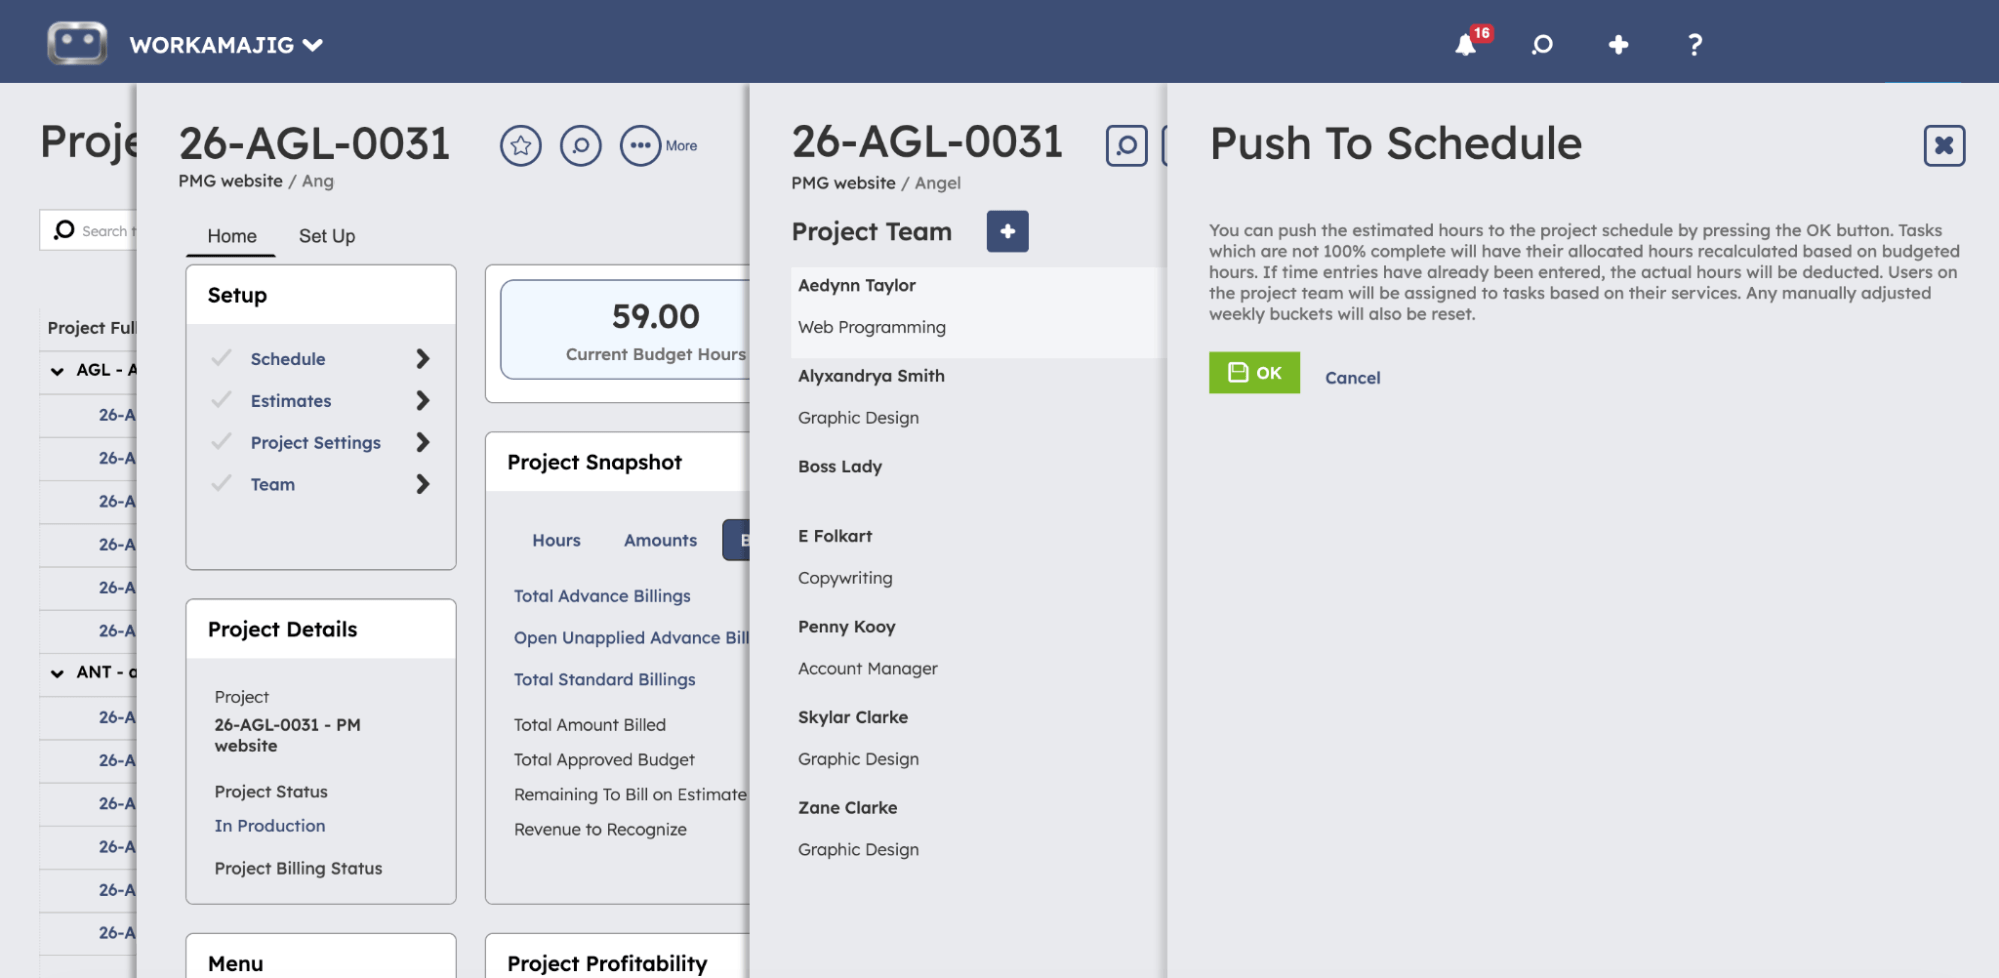
- From scratch (with the help of our automated estimating engine). If you want to start from a blank slate — maybe for an entirely new project or service line — our system offers dedicated tools to develop labor and non-labor estimates and combine them into a single project budget.
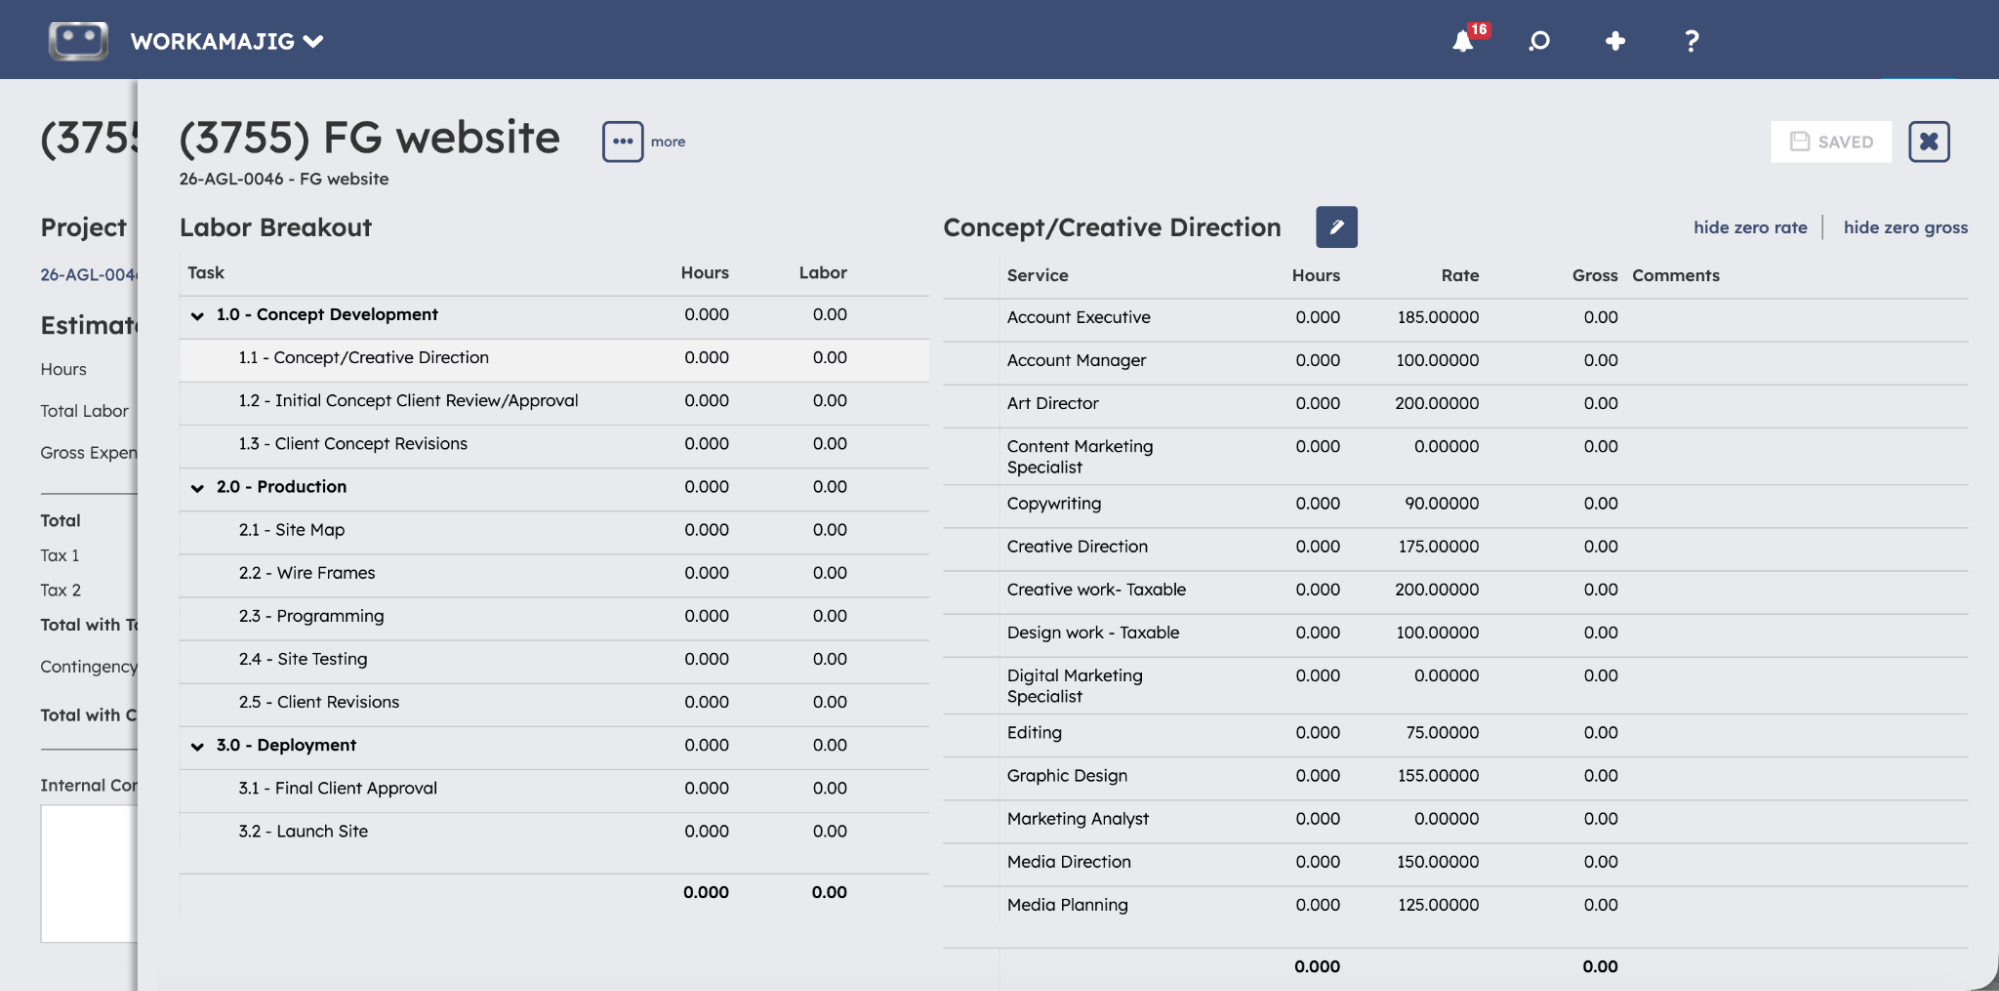
To build an estimate from scratch, you can head over to our estimating screen, which brings your workflow and services into a single view. So you can go task by task, choose which services to include, and allocate hours for each activity — which gets you a labor estimate.
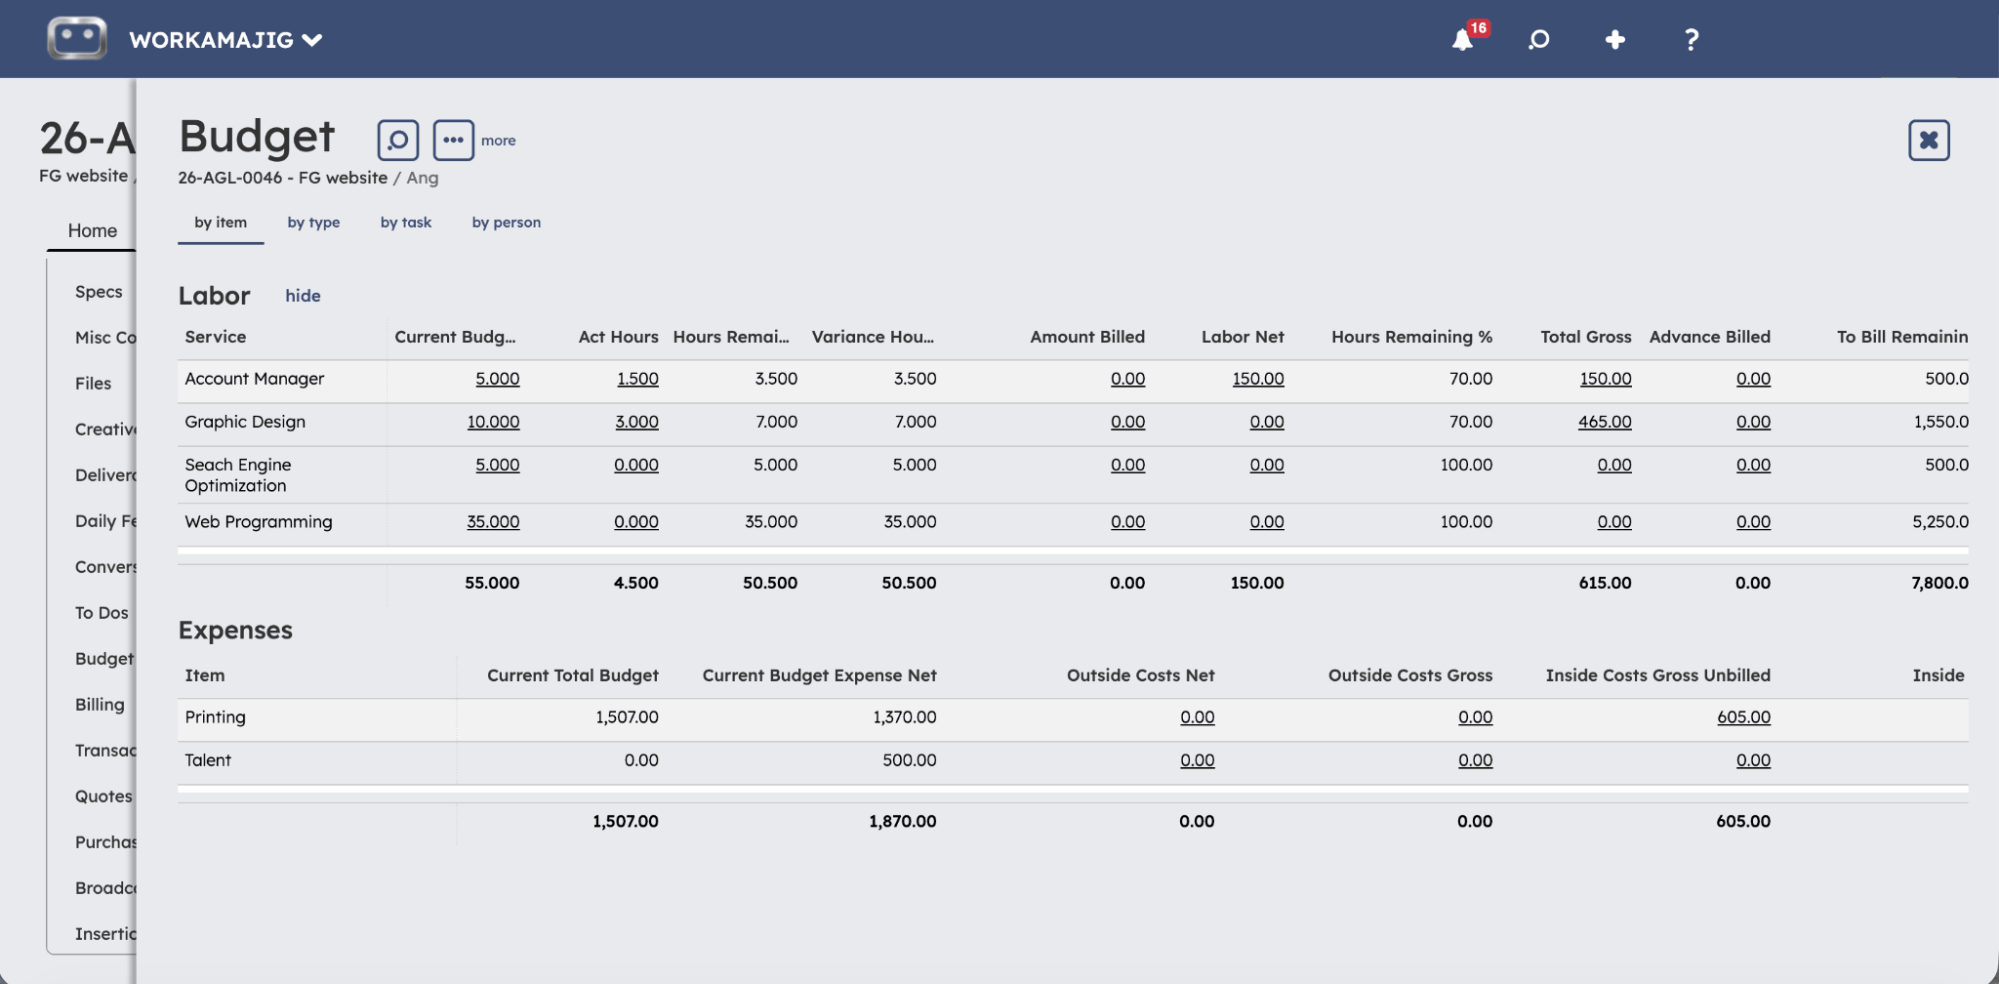
Then our system also offers a dedicated tool for managing non-labor expenses. From a single screen, you can tag each expense to a specific task or project, assign the vendor, set quantities, and apply your markup.
Take a video shoot for a campaign, for example. You'd add the equipment rental as its own line item, tie it to the production phase, assign your usual rental house, key in the quantity — five shoot days, say — and apply your usual markup.
Workamajig even lets you issue requests for quotes (RFQs) to several vendors and compare their bids as they arrive. Once you settle on a vendor, the estimate updates to match their quote. And once the project is underway, the system keeps that estimate-vs-actual picture up to date as the work progresses.
2. Automate time and expense tracking
Workamajig offers several handy tools to track all labor and non-labor costs across project workflows, reducing headaches for everyone involved and ensuring line items are captured consistently and accurately.
Our system does more than just monitor these costs; it also equips managers with the tools they need to prevent overruns and optimize resource utilization, giving projects their best shot at reaching the finish line in peak financial health.
Workamajig’s accounting software is also fully equipped to support agencies with international business and teams. Our system is GAAP-, GDPR-, and HMRC-compliant, with extensive multi-currency, multi-entity, and multi-office support. So you can manage expenses, transactions, vendor invoices, and bank accounts in any currency you work in — and for separate entities — without throwing project tracking or reporting off course.
Labor costs: Time tracking and resource optimization
Workamajig's native time-tracking tools are built into our task cards, so users can conveniently log time as they work from their personalized dashboards. They don’t have to switch tools, open up a separate timesheet, or navigate to a different part of the system.
Users can choose their preferred option for tracking their hours:
- Automatic capture. Enter time directly on task cards, while Workamajig auto-populates all necessary fields.
- Timers. Users can start and stop timers as they work. They can also pause them during breaks and toggle between tasks throughout the day.
- Timesheets. For manually logging time entries.
- Calendar event tracking. Staff can connect their work calendars to our systems and conveniently capture calendar events — meetings, internal reviews, client calls, etc. — in Workamajig. They only need to confirm their attendance during those hours for it to be recorded against the project.
Users can also choose to leave comments alongside their entries, which is useful when they need to share context with managers. For example, if a task took 3 hours longer than planned because of rework or additional client requests, a designer can leave a note explaining the variance.
![Workamajig - Today - Creatives - Tasks - New Time Entry for Projects [GIF]](https://www.workamajig.com/hs-fs/hubfs/Workamajig%20-%20Today%20-%20Creatives%20-%20Tasks%20-%20New%20Time%20Entry%20for%20Projects%20%5BGIF%5D.gif?width=650&height=690&name=Workamajig%20-%20Today%20-%20Creatives%20-%20Tasks%20-%20New%20Time%20Entry%20for%20Projects%20%5BGIF%5D.gif)
As employees log their time, Workamajig automatically calculates labor costs and pushes them downstream alongside project hours. They flow into our:
- Centralized timesheets, where managers can review, approve, and reject submissions. Rejected entries are bounced back to the user so they can make corrections and resubmit them.
- Project schedules and budgets, which are updated in real time so PMs can monitor each project’s health and catch issues early.
- Time and productivity reports, so managers can analyze hours by client, service, project, or team and compare billable vs. non-billable hours.
Then, when it’s time to bill clients, managers can pull up project hours and labor costs in our electronic billing worksheets to decide how to handle them. More on this below.
Read more: Best Agency Time Tracking Software
Non-labor expense tracking
Workamajig’s suite of project expense-tracking tools makes it easy for teams to capture non-labor costs as they’re incurred, maintain a digitized log, handle reconciliation, and finally push relevant costs to invoices for billing.
These tools solve all the usual challenges that project and accounting teams run into — lost receipts, manual reconciliation, paying vendors, engagements and transactions in different currencies, and scattered data — ensuring actuals are smoothly captured and logged against project budgets and reports.
Here’s what’s included in our toolkit:
- Receipt capture. Team members can easily digitize their receipts and store them in our system so they never have to worry about losing them again. Users can even capture receipts via mobile and conveniently tag them against projects.
- Expense reports and reimbursement management. Users can submit expense reports through our system — managers can then review them and approve reimbursements.
- Credit card spend management. Workamajig lets teams conveniently pull in their credit card spending data via our Plaid connector and log charges against projects. They can also set up auto-sync to pull in new charges each night, so users only need to review and tag them.
- Vendor invoice management. Teams can easily manage vendor relationships all the way from requesting bids to making payments. Users can attach vendor invoices and reconcile them with purchase orders, work orders, and receipts. Our system supports online vendor payments through Edenred Pay (formerly CSI) and AvidXchange (formerly FastPay).
- Media buying integrations. Creative teams can conveniently plan their media buys, incorporate the costs in estimates, and track actual spend by pulling those costs directly into Workamajig through our integrations with Strata/FreeWheel, Mediaocean, Bionic, and GaleForceMedia.
3. Monitor actual project costs against budgets as work happens
Workamajig offers a suite of handy tools to track project performance, diagnose issues, and update profitability forecasts as plans change.
First, managers can use our budget drill-downs to catch any expenses, tasks, or resources that are running over — so they know where to intervene. These breakdowns organize and display project budgets by item, type, task, or person for any project or campaign.
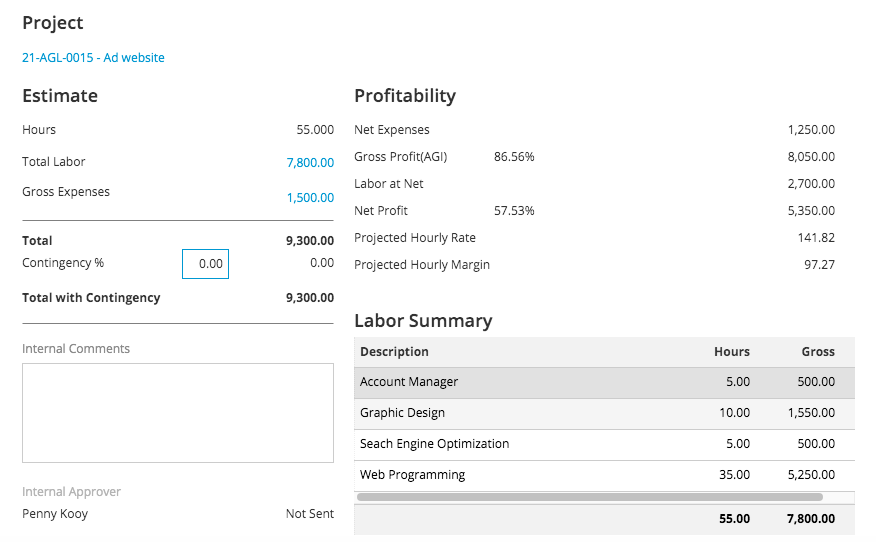
Even more conveniently, though, Workamajig comes with project profitability breakdowns that show you expected profitability throughout the project, calculated automatically as teams complete and move through project phases. They track profitability across four views, including:
- Estimate — Your planned profit baseline from approved estimates and change orders.
- WIP — Unbilled labor and costs accumulating as work happens but before invoicing.
- Actual — Realized profit from posted GL transactions — invoices, receipts, and journal entries.
- Write Off — Billable work that's been scrubbed, representing pure margin erosion.
PMs can see planned profit, unbilled work-in-progress, realized results, and losses side by side at any point during the project — so they can forecast updated profitability, catch issues, and correct course before projects become doomed to overruns.
Each project’s actuals, budget, and timeline are updated in real-time as users log their hours and track expenses. Managers can conveniently track the status and health of all their live projects from our centralized project monitoring dashboard. Check it out below:
![Workamajig dashboard: Projects and Project Status [GIF]](https://www.workamajig.com/hs-fs/hubfs/Workamajig%20-%20Projects%20and%20Project%20Status%20%5BGIF%5D.gif?width=1714&height=853&name=Workamajig%20-%20Projects%20and%20Project%20Status%20%5BGIF%5D.gif)
For each project, our dashboard displays:
- Timelines and progress in a Gantt chart view (on the right-hand side). Here, the black bars show how far along each project is, and you can hover over any project’s charts to pull up big-picture details, including its start and finish dates.
- Status breakdowns (on the left-hand side). You’ll notice dedicated columns, such as “Financial Status,” “Project Timeline,” “Project Status,” “Allocated Hours,” “Actual Hours,” and “% Complete.”
- Color-coded project health indicators. The icons located in the status columns visually indicate each project’s health at a glance — green means all’s well, yellow signals at risk of delays or budget overruns, and red means a project has been delayed or exceeded its budget.
Workamajig also sends automatic alerts to managers when a project enters the yellow zone, so they can quickly investigate and intervene before it goes off track.
Read more: Project Expense Tracking: Practical Steps, Tips, & Tools
4. Strategically manage change requests
Our change management tools keep scope creep in check by structuring how change requests are handled and allowing you to see exactly how a proposed change will affect profitability before anyone commits.
When a request comes in — whether it's adding a new resource, tacking on extra tasks, or extending hours on a job — you can model the financial impact first, then negotiate how to move forward. (Will you bill the client for the extra work? Should you assign lower-cost resources?)
Workamajig offers two connected toolsets for change management: one for the requests and the second for the financial side. Here’s how it works:
- Change request forms. Custom fields and spec sheets force requesters to spell out exactly what they need — no more vague "can we also" asks that leave your team guessing at the scope (and cost). You can set up different forms for different clients, project types, or departments.
- Submissions from any stakeholder. Clients can submit these through their portal, where requests automatically link to the correct project. Internal team members can also submit requests through the project dashboard.
- Approval routing. You decide who needs to sign off and whether multiple approvers are required. Set due dates for each step, route to approvers in sequence or parallel, and choose whether you need unanimous approval or just one green light. Approvers can also loop in additional reviewers mid-flow if a request needs more eyes.
- Version history. Every approved change updates the project's specs, while Workamajig keeps every prior version on file. You always have a full record of what changed, when, and who requested it — useful context when you're reviewing what impacted profitability at the end of an engagement.
Only one change request can be active per project at a time, so you're never dealing with competing changes muddying the picture.
Change order estimates: see the profitability impact before you approve
When a change request involves budget implications, Workamajig connects the request to a change-order estimate. This estimate works just like your original project estimate, but it only captures what's being added or removed as a result of the change.
The key here is that you get to evaluate this estimate before it hits the budget. Need to add a senior designer for 20 extra hours? You can see exactly how that affects your margins.
Once approved, Workamajig automatically rolls the change order into the project's current budget. From there, you can track three numbers side by side: the original budget (your initial approved estimate), budgeted change orders (all approved additions or subtractions), and the current budget (the total of everything approved to date).
This means you can easily trace the impact of change requests on the project budget over time. For example:
- Profitability reports always reflect the latest approved budget, with original and change order amounts recorded separately. You can see exactly how much budget has been added or removed by changes, and whether those costs were accounted for in the client invoice.
- Schedule-driven adjustments flow in automatically. If you've already updated allocated time on the schedule to reflect the change, Workamajig pulls those adjustments into the change order estimate, so there’s no double entry.
- Nothing hits the budget without approval. Change order estimates only feed into the project financials after they've been signed off, so unapproved requests can't eat into your margins.
5. Bill for all your engagements and recognize revenue at the right moment
So far, we’ve focused on using Workamajig to manage the cost side of profitability tracking — but the revenue side is just as important. Agencies have to be especially careful here because they run different engagement types, including ones where revenue is split and recognized over different periods.
For example, you might collect 40% upfront on a fixed-fee project, bill media before paying the vendor, or deliver a full month of retainer work that doesn't get invoiced until the next cycle. If you book revenue when it's billed instead of when it's earned, the P&L won’t reflect how you’re actually doing business.
Workamajig bridges these gaps with a billing workflow that matches how agencies actually operate, and revenue recognition tools that keep income aligned with what’s being delivered. Our system supports fixed-fee, time-and-materials, retainer, and media billing out of the box, along with dedicated retainer management tools for more complex setups, such as hours-based retainers. You also get the flexibility to control what gets billed and when:
- Progress invoicing. Bill a percentage of any line item at each project stage, with the remainder staying in the system for a future invoice. You decide what gets recognized today.
- Split billing. When project costs are shared across multiple client entities, Workamajig automatically generates a parent tracking invoice for the total, plus individual invoices for each paying entity.
- Mass billing. Generate a batch of invoices for multiple projects, retainers, or media orders in one sweep.
As we briefly mentioned above, Workamajig’s electronic billing worksheets allow managers to review and edit line items before they reach the client invoice.
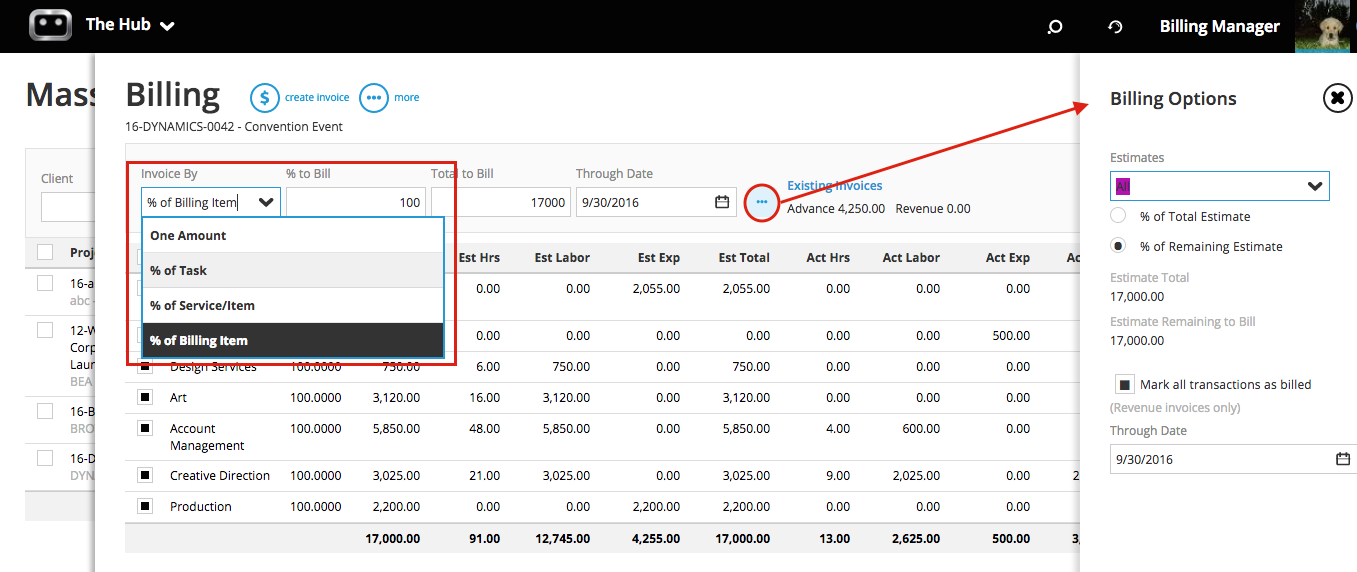
When a user generates an electronic billing worksheet in our system, Workamajig automatically pulls in all the project’s details, including time and expense data, and applies the project’s billing method. From there, the worksheet goes to managers for review. They can edit line items, mark things up or down, write off what shouldn't be billed, and approve the final numbers.
After approval, the billing or accounting team generates the client invoice from the approved worksheet, with tax calculated and applied automatically via our Avalara integration. The invoice can then be sent to the client, who can access it through their portal and pay online (thanks to our integrations with PayFlowPro / Authorize.net).
Read more: Best Creative & Advertising Agency Billing Software
Revenue recognition: putting income in the right period
Workamajig offers a range of revenue recognition tools to support all your agency’s engagements.
- Advance billing separates cash collected from revenue earned. When you bill upfront, the amount hits a deferred income account — not revenue. It sits there as a liability until you earn it. As you issue invoices against the deposit, the balance is recognized as revenue. So a 40% upfront payment doesn't inflate your profitability before you've done the work.
- Media prebilling keeps cost and revenue in sync. Media buys often get billed to the client before the agency pays the vendor. Without prebilling, the project appears more profitable in one period and less in another because costs are recognized later than income. Workamajig posts matching accrual entries on both sides so they land in the same period.
- WIP (work-in-progress) posting captures everything else at month-end. Any unbilled labor and direct expenses on active projects are recorded on the balance sheet as assets, offset against cost of sales. This means costs and their related revenue are recognized in the same period, even before the client receives an invoice. Then, once billed, the entry reverses automatically. You can post and unpost WIP as needed, and break down balances by client and project to see how long charges have gone unbilled.
6. Evaluate profitability from our reporting suite
Because Workamajig combines project management, time tracking, and full GL accounting software in one system, our reporting suite pulls from every corner — time entries, vendor invoices, expense reports, billing worksheets, posted GL transactions — without any stitching or reconciliation between tools. The numbers are consistent whether you're drilling into a single project post-mortem or comparing margins across a specific client portfolio or service line.
Below, we cover the reports that agencies rely on most for project profitability analysis. The project budget and recap reports show you what happened at the project level — where actuals diverged from estimates, which phases ran over, which came in under. Our P&L’s let you calculate true profitability after overhead is factored in and compare profitability across your portfolio by project type, client, or campaign.
Finally, the time and productivity reports explain the why behind these numbers — including the financial contribution of each resource, how much billable effort actually converted to revenue, and whether your pricing strategy for different service lines is holding up.
Project Budget Analysis
The Project Budget Analysis is your go-to for comparing budgets to actuals across multiple projects in a single view. It brings together budgeted amounts, actuals, labor gross, outside costs, open orders, and amounts billed — grouped by client, with collapsible headers and subtotal rows that roll up each client's portfolio.
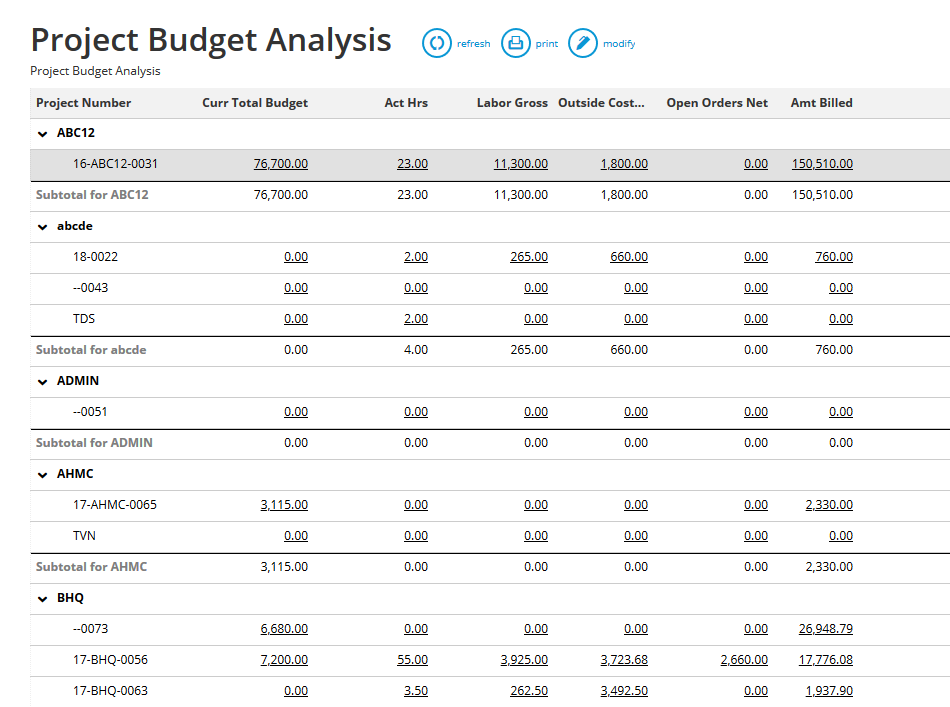
It's designed to help PMs scan and catch issues, so they can investigate further. Each project sits as a row under its client, and the columns flag where things are running smoothly and where they're off.
When something catches your eye — say, a project's labor gross is running higher than expected, or outside costs on a campaign are climbing past the estimate — you can click the value to pull up every related transaction. From there, you can trace back to the specific time entry, vendor invoice, or expense line that created the variance, all without leaving the report.
The filters let you narrow results by date range, client, project type, or account manager. We even have an option for "Project Has Budget Warning," which sorts results by projects with actuals exceeding 80% of their budget — similar to the yellow and red status indicators on our project monitoring dashboard.
Project Recap Analysis
The Recap Analysis offers a deep dive into how a specific project went vs. how you planned it — with entries organized by phase and task. For each task, you get budgeted vs. actual labor dollars, budgeted vs. actual hours, and baseline due date vs. actual completion date. The report also features a color-coded variance column (labor results) — red for over budget, green for under, and blue for on target — so a quick scan tells you where to focus.
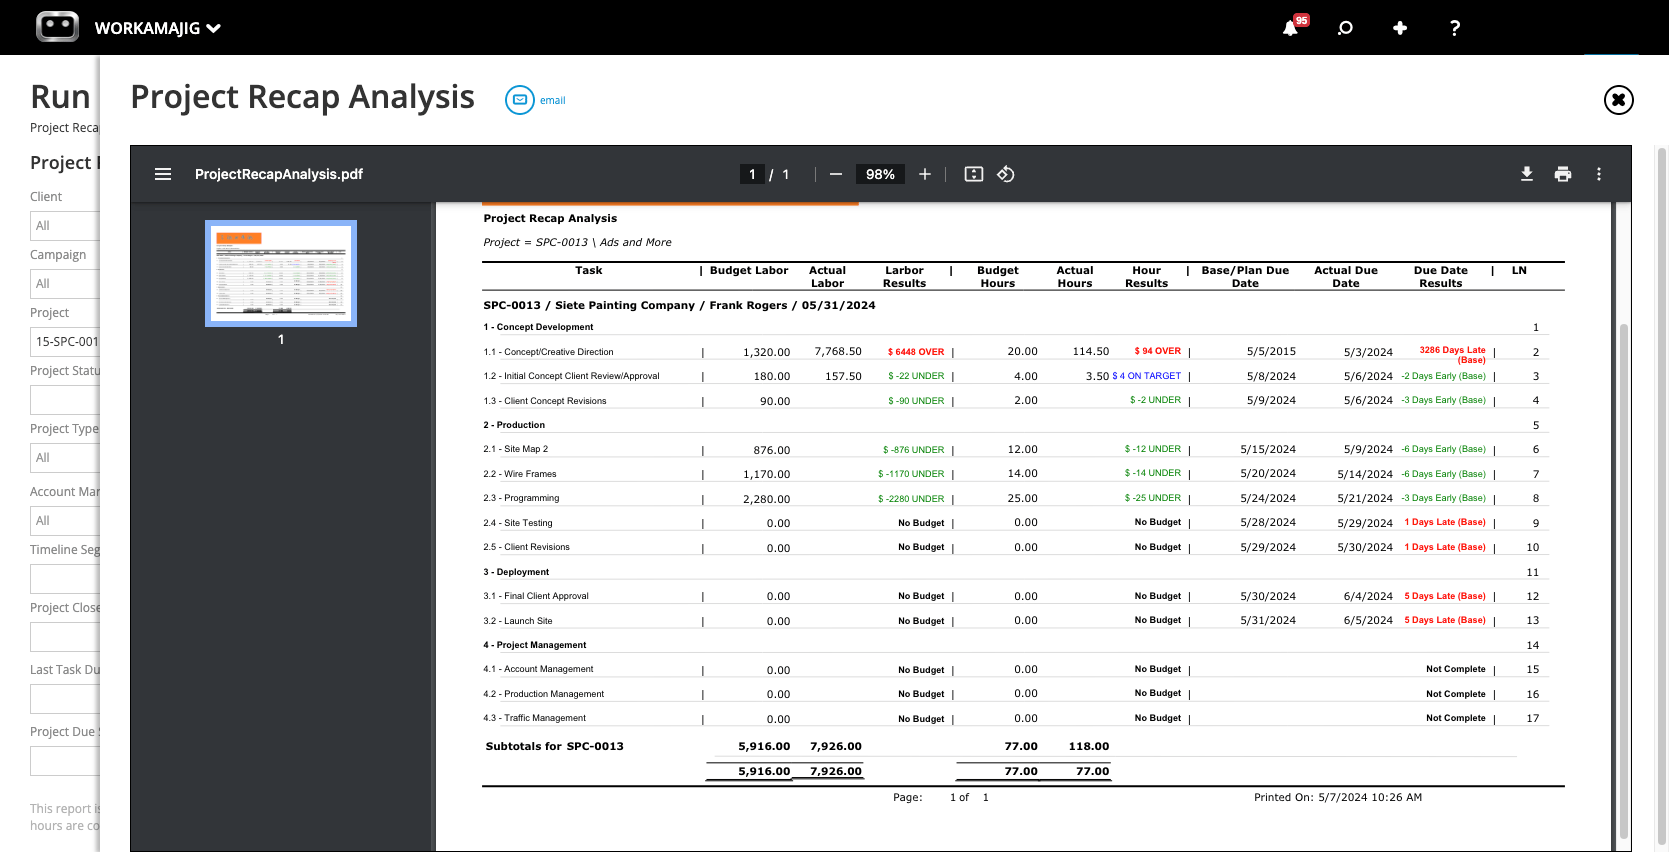
For example, let’s consider the project above. Concept Development's actuals were noticeably higher than estimates, primarily driven by the Concept/Creative Direction task. Production, on the other hand, came in well under across the board — with every task finishing below its allocated hours.
So the creative phase is where margin eroded on this project. Now you can investigate further. Was the estimate too aggressive on concepting? Did the client push scope during the creative phase? Was the wrong resource assigned to creative direction?
Profit & Loss Reports
The budget-level reports above are based on actual transactions (time entries, expenses, invoices). You’ll need the P&L reports below — which pull from posted GL transactions and support overhead allocation — to get a true picture of profitability once everything is accounted for.
Workamajig offers options for generating P&Ls:
- Project P&L (Detail View) zooms in on a single project and breaks down profitability by GL account — revenue, COGS, agency gross income (AGI), expenses, and allocated overhead. This view helps you identify why some projects came in with thin margins, despite initial estimates and project revenue indicating a stronger picture. Maybe COGS came in higher than expected because a vendor invoiced more than they quoted.
- Project P&L (Multi-View) displays profitability across multiple projects on a single screen, with grouping options by project type, client, account manager, or status. You can group by project type to compare profitability across different kinds of work — say, branding projects vs. website builds vs. media campaigns. This helps you spot patterns, including the service lines that consistently carry a margin and where you're losing money.
- Campaign P&L (Multi-View) rolls up profitability for all projects associated with a campaign (or portfolio). For multi-project engagements — say, a product launch that includes a brand refresh, a website build, and a media campaign — this report shows you the profitability of the full engagement.
- Client P&L (Detail and Multi-View) does the same thing at the client level. The detail view shows a single client's profitability broken down by GL account; the multi-view compares profitability across clients. This report is useful during account reviews, renewal conversations, and the hard question of whether a client is worth keeping at their current rate.
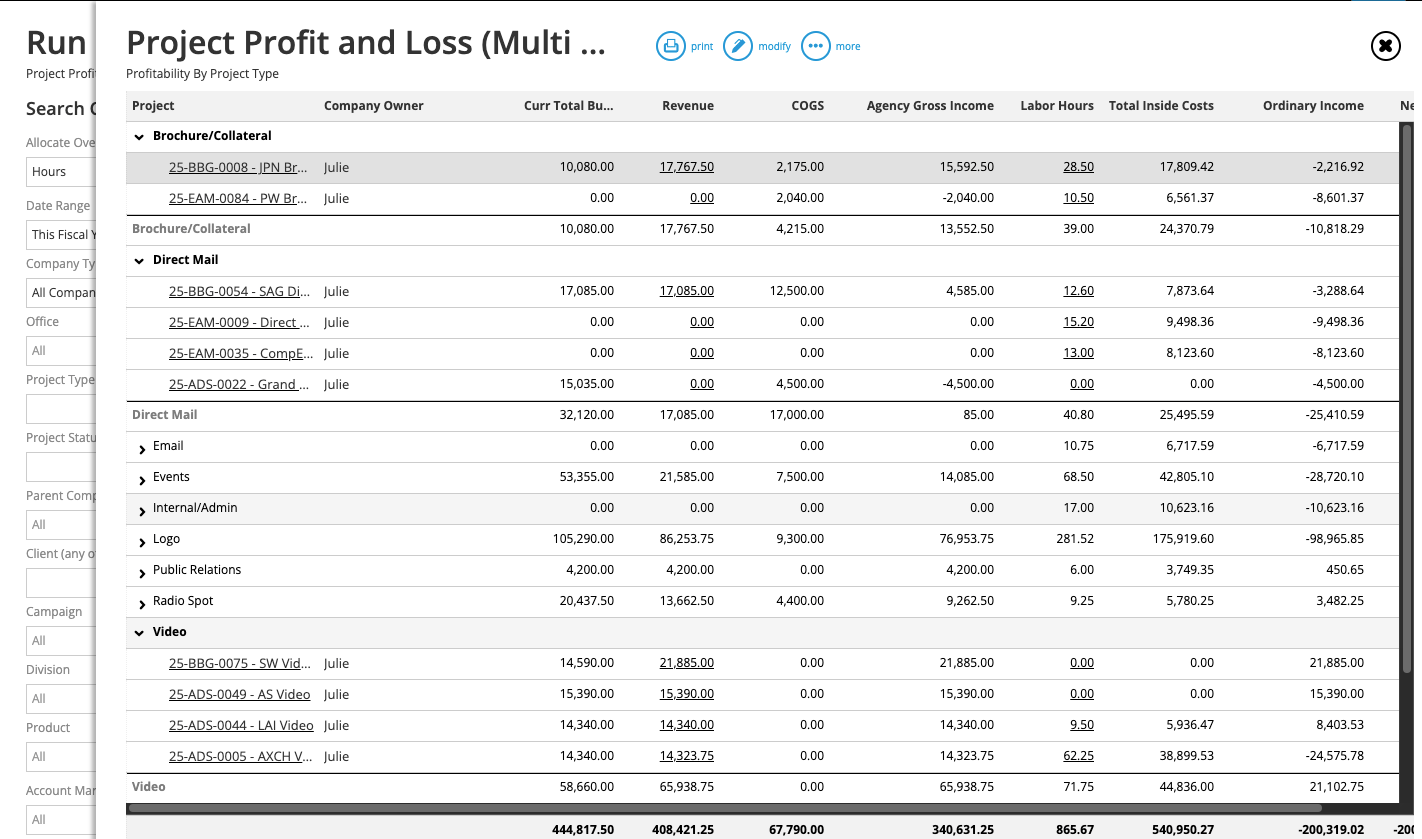
Workamajig calculates an "overhead pool" — the total of all expenses posted to COGS, expense, and other GL accounts that aren't linked to a client or client project (or are tied to a client you've designated as an overhead client). Think rent, utilities, insurance, shared software licenses, internal salaries.
When you run a P&L report, you choose how that pool gets distributed across projects, clients, or campaigns. Workamajig offers four methods:
- By hours. Overhead is distributed proportionally based on the total approved hours entered for the client or project, divided by the total approved hours entered across the agency. If a project consumes 15% of your agency's total hours in a given period, it gets allocated 15% of the overhead pool.
- By labor cost. Same concept, but weighted by the cost of those hours rather than the raw count. The calculation uses each employee's standard hourly cost from their employee record: (total labor cost for client or project hours) / (total labor cost for all agency hours) = percentage of overhead to allocate. This method is more accurate when you have a mix of expensive senior staff and lower-cost junior staff.
- By total billing. Overhead gets distributed proportionally based on revenue: (total dollars invoiced to the client or project) / (total dollars invoiced across the agency). So higher-revenue projects absorb more overhead, making this method a good choice when overhead correlates more with revenue volume than with labor effort.
- None. Skip the overhead allocation entirely and evaluate profitability based purely on direct costs and revenue. Useful when you want a clean view of project-level gross margin before the overhead conversation, or when you're reviewing overhead allocation separately.
Each method produces different numbers, and there's no universal right answer. But make sure you stay consistent — choose the method that best reflects how your agency operates, and apply it across the board.
Note: The Overhead Allocation Details report shows every transaction in the overhead pool for a given date range. It's worth running this monthly to verify the pool is clean — sometimes transactions that should have been billed to a client end up in overhead by mistake, inflating the pool and skewing your profitability numbers.
Time Productivity Analysis
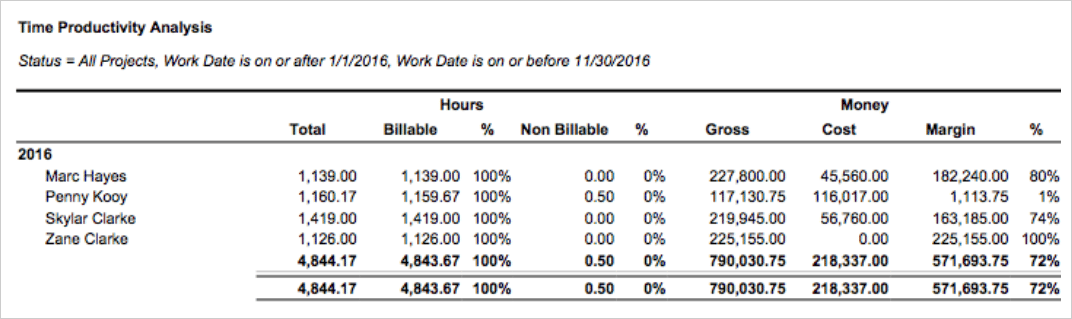
The Time Productivity Analysis links each resource's utilization rate and realization rate to their actual cost and revenue generated — so you can see how each resource’s time converts to revenue. For example, as shown above, Marc Hayes and Penny Kooy both logged a similar number of hours — 1,139 and 1,160, respectively — all of which were billable.
But the breakdown shows that Marc generated $227,800 in gross revenue against $45,560 in costs, leaving an 80% margin, while Penny generated $117,130 in gross revenue against $116,017 in costs — a 1% margin. She's essentially breaking even despite being fully utilized, which suggests either her billing rate is too low relative to her costs, or her time is being written off or discounted before it hits the invoice.
Chargeability Report
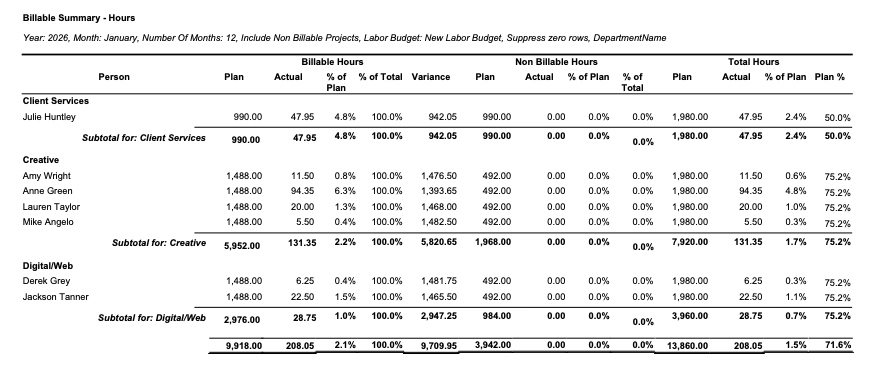
The report breaks down chargeable and non-chargeable hours for each resource and role, shown as a percentage of total hours. It also compares your actual performance against your original plan — so you can see whether you over-planned or under-utilized resources, and whether you're meeting your chargeability targets.
Hourly Reports
Our productivity reports reveal how and where your team's time is going — broken down by client, service, account manager, and department. And while it doesn’t directly provide financial insights, you can read it alongside financial reports (especially P&Ls) to get a complete picture of agency efficiency. These reports help you understand which efforts are contributing to profitability and what’s holding you back.
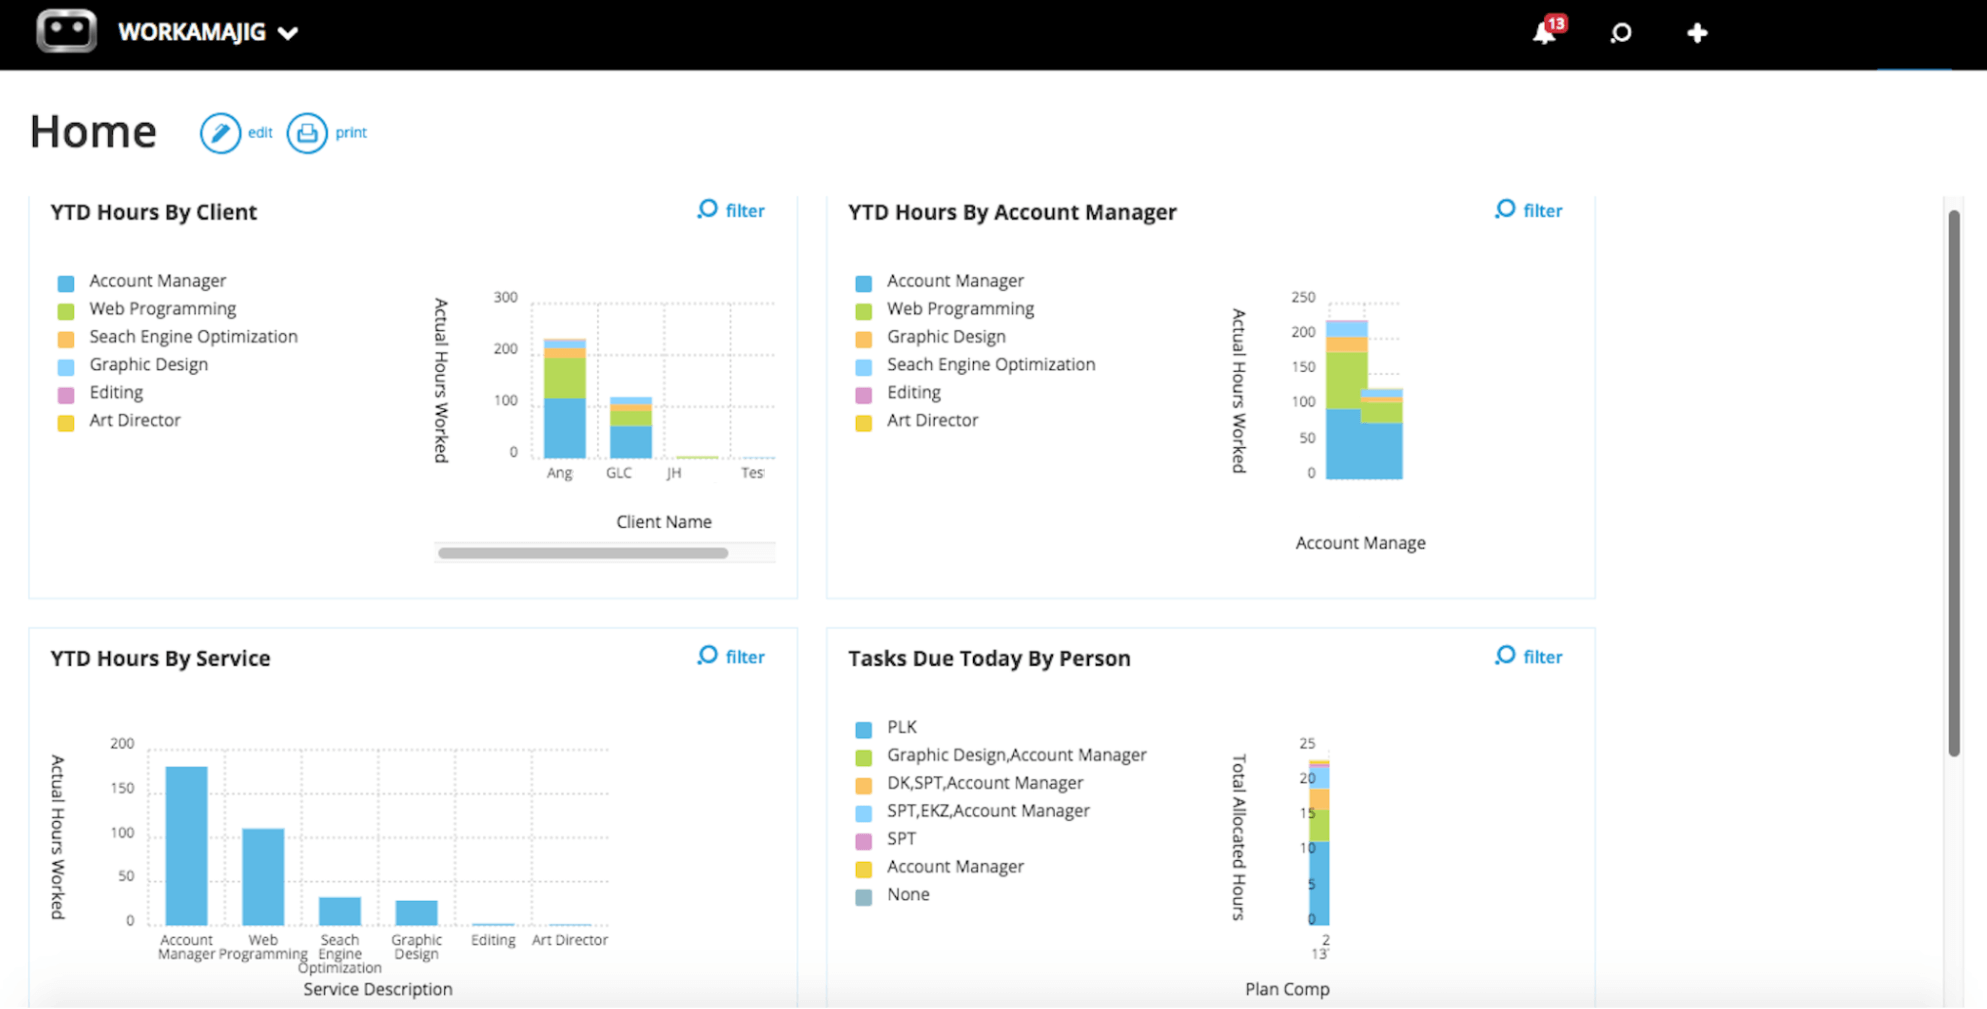
For example, the year-to-date (YTD) Hours By Client chart above shows that one client (Ang) is consuming significantly more hours than any other. If that client's contract value doesn't reflect the volume of effort, your team could achieve a higher return on investment (ROI) by spending more time on higher-margin clients.
Similarly, the YTD Hours By Service shows that Account Management and Graphic Design log the most hours by a wide margin, while services like Editing and Art Direction log far fewer. If Account Management is a low-margin or non-billable service eating up that much capacity, it's dragging down your overall profitability.
FAQs on Project Profitability Tracking
What is the project profitability index and why is it important?
The profitability index is the amount of money earned against every dollar invested, after factoring in timing of cash flows.
Project profitability index formula: Present Value of Future Cash Flow / Initial Investment.Here’s what the results mean:
- An index of less than 1 indicates that an agency will lose money on a project.
- An index equal to 1 means an agency will break even — so it’s for the organization to decide whether it’s worth taking on the project. For example, a business that’s just starting out may take on a few of these projects for their portfolio value alone.
- An index of more than 1 indicates that the project will generate profit and is probably worth taking on.
What are the essential features of project profitability tracking software?
The best project profitability tracking software should offer all of the following under one roof:
- Estimating tools — that pull relevant current and historical data to generate accurate estimates, forming a baseline project budget.
- Time tracking with utilization reports — for accurately tracking project hours, employee productivity, and billable utilization.
- Expense management — to capture and manage non-labor costs as they’re incurred, including media buys, vendor costs, out-of-pocket expenses, and more.
- Real-time project budget tracking — to compare actuals vs. estimates throughout the project lifecycle, accurately track cost burn, and catch overruns early through warnings and automated alerts.
- Change management tools — to manage change requests, forecast their financial impact, and generate change orders that roll new estimates into the project’s budget.
- Project billing and revenue recognition tools — to support all your different types of client engagements (fixed fee, time and materials, retainer, media) and ensure P&Ls reflect the ground reality.
- Extensive project reporting — to analyze profitability, productivity, and performance from different perspectives and accurately allocate overhead from the GL.
What’s the best software for tracking project profitability?
Systems like Workamajig, Advantage, Clients & Profits, and e-Silent Partner that combine project management with native accounting are the best software for tracking project profitability. They allow you to manage finances within project workflows — from generating accurate estimates to tracking time and expenses, monitoring project budgets, handling change requests, billing for different project types, recognizing revenue, and allocating overhead.
Plus, since they host all your project, resource, client, and financial data, these systems offer the most comprehensive overview of profitability — including at the agency, client, service, project, and resource levels.
You can learn more about these systems in our guide: Best Creative Agency Accounting Software
How do project profitability tracking tools handle expense management?
It depends on the type of system that you’re using:
- “Universal” project management software, such as Asana, ClickUp, or Monday. These solutions offer time tracking and basic expense management (e.g., you can create numerical fields and custom expense types to track), but they don’t support the complexities of agency workflows — where you have different employee hourly rates, service rates, project billing types, etc.
- Agency project management software with native financial management tools, such as Scoro, BigTime, and Teamwork. These systems offer native estimating, time and expense tracking, billing and invoicing, and financial reporting tools. However, they rely on third-party integrations (typically QuickBooks, Xero, or Sage Intacct) to handle the full breadth of GL accounting workflows. So they don't natively support things like a complete chart of accounts, bank reconciliation, overhead allocation, or GL-level financial reporting — all of which directly affect how accurately you can evaluate project profitability.
- Agency management systems with native accounting software, such as Workamajig, Advantage, Clients & Profits, and e-Silent Partner. These are the most comprehensive project expense management solutions, with dedicated tools for managing all labor and non-labor expenses, including time tracking, rate cards, receipt capture, media buying integrations, vendor management, expense reports, reimbursements, multi-currency transactions, and more.
Workamajig: The All-in-One System for Agencies Running Profitable Projects
Many agencies rely on a combination of scattered tools — from spreadsheets to time-and-expense trackers, project management tools, and accounting software — to track project profitability, but none of these systems are specifically designed for this purpose.
So these setups create loads of headaches for your team. Spreadsheets break down, tracking time accurately is a pain, the same data has to be entered across multiple systems, and maintaining integrations becomes a job of its own. And after all that effort, you still don’t get real-time or accurate insights into project profitability.
That’s why agencies that are serious about running profitable projects at scale adopt systems like Workamajig. Our all-in-one solution is specifically designed to support project profitability — from providing accurate estimates to tracking costs as projects progress, managing billing, recognizing revenue, and evaluating each project’s financial health post-mortem.
Request a free demo of Workamajig and take the first step toward running a more profitable agency.
Read more: